
Customize your first application further
In this tutorial you'll discover advanced features of the visual app builder to customize the visual aspects of a simple application
Objective
In this tutorial you'll discover advanced features of the visual app builder to customize the visual aspects of a simple application.
This tutorial contains extended content for the Getting Started section called Build and deploy a front-end application.
Requirements
This tutorial assumes that you have been through all five sections of the Getting Started tutorial. Your Data Processing Engine, your Lakehouse Manager, your Analytics Manager have been configured as described in their respective pages, and you have deployed an API as well as an APP which you are going to customize.
Create a more advanced chart
First, let's discover one more chart type: a horizontal bar chart to show the top 7 stations in terms of total traffic.
Instead of choosing a query that has already been prepared in the Analytics Manager, you can also create new queries on the fly when creating a chart. To do this, shrink down the first panel and create a second one next to it.
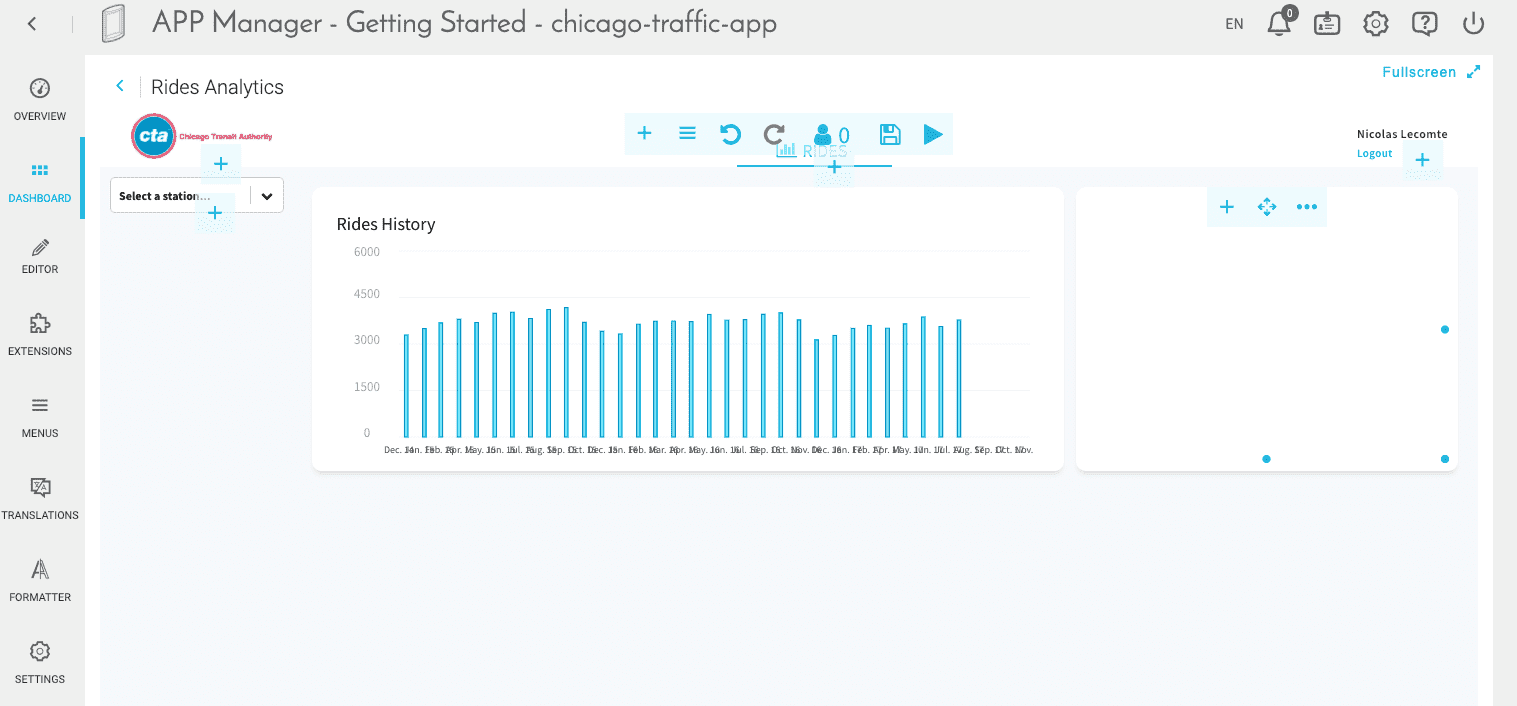
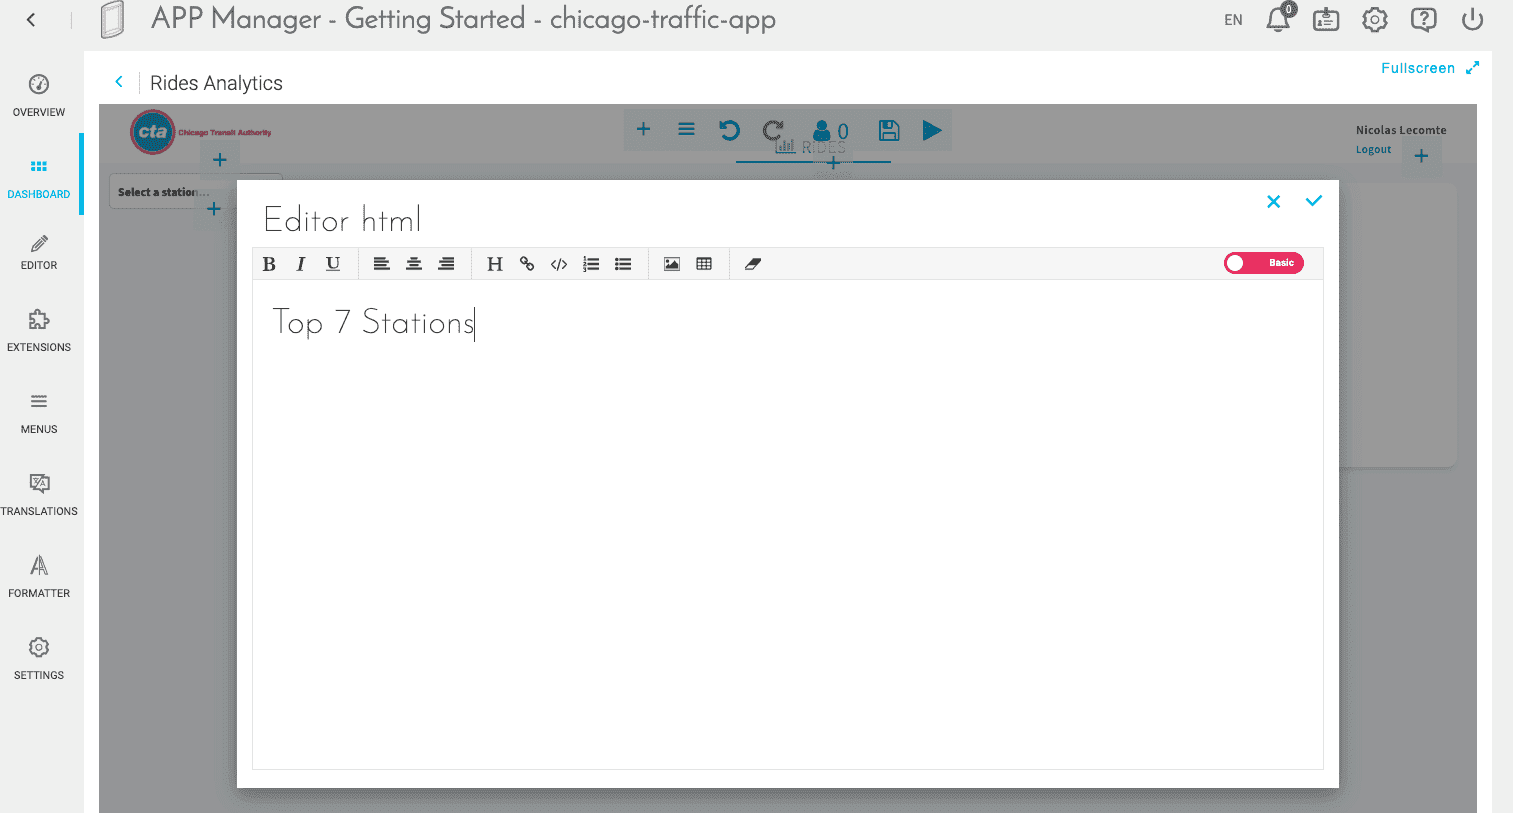
Inside the second panel, click on the ➕icon and select HTML. Name it Top 7 Stations with style H1.
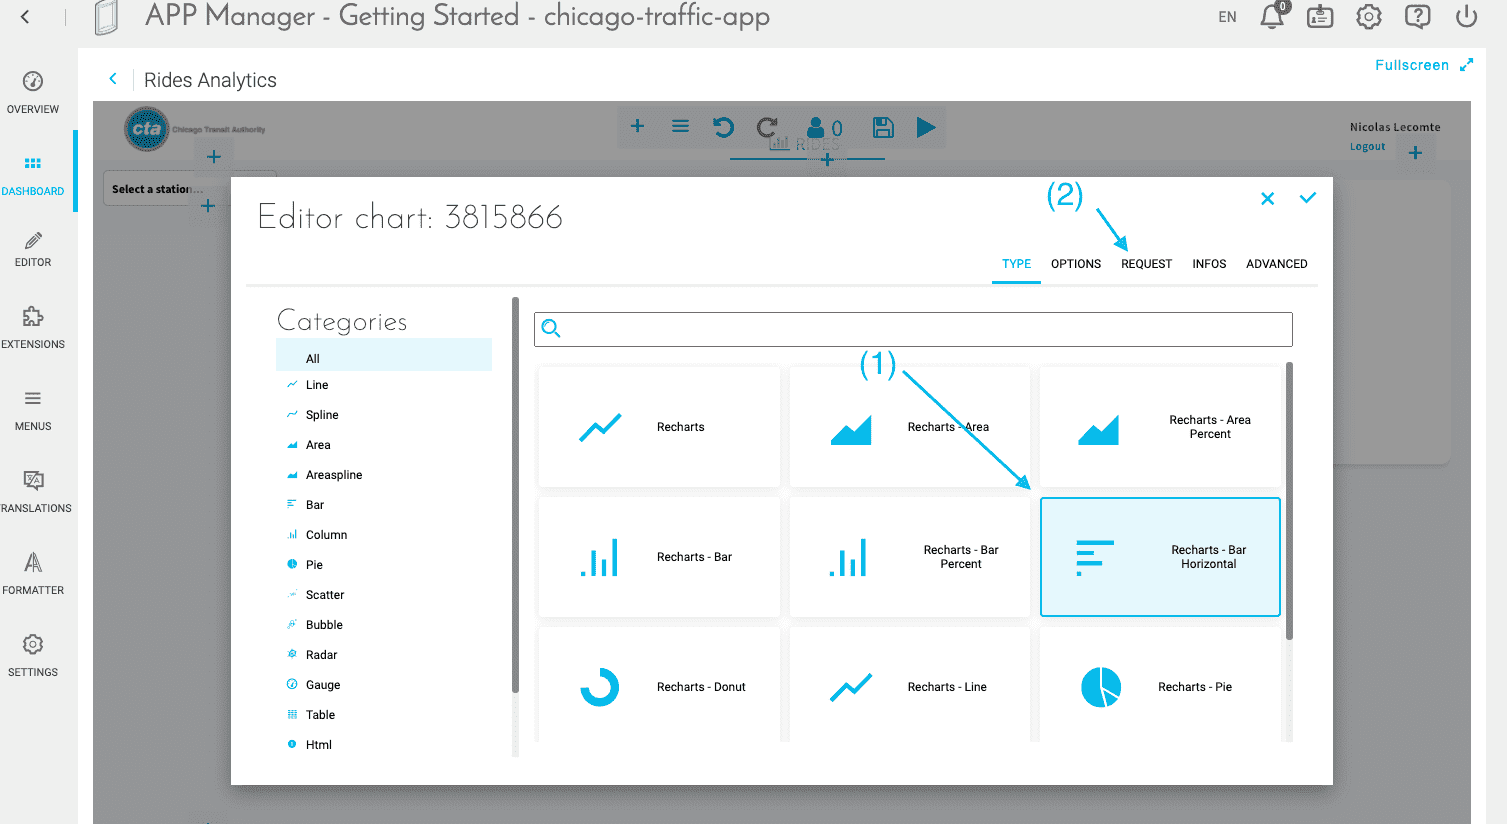
Inside the second panel, click on the ➕icon and select Chart. Pick the Recharts - Bar Horizontal type.
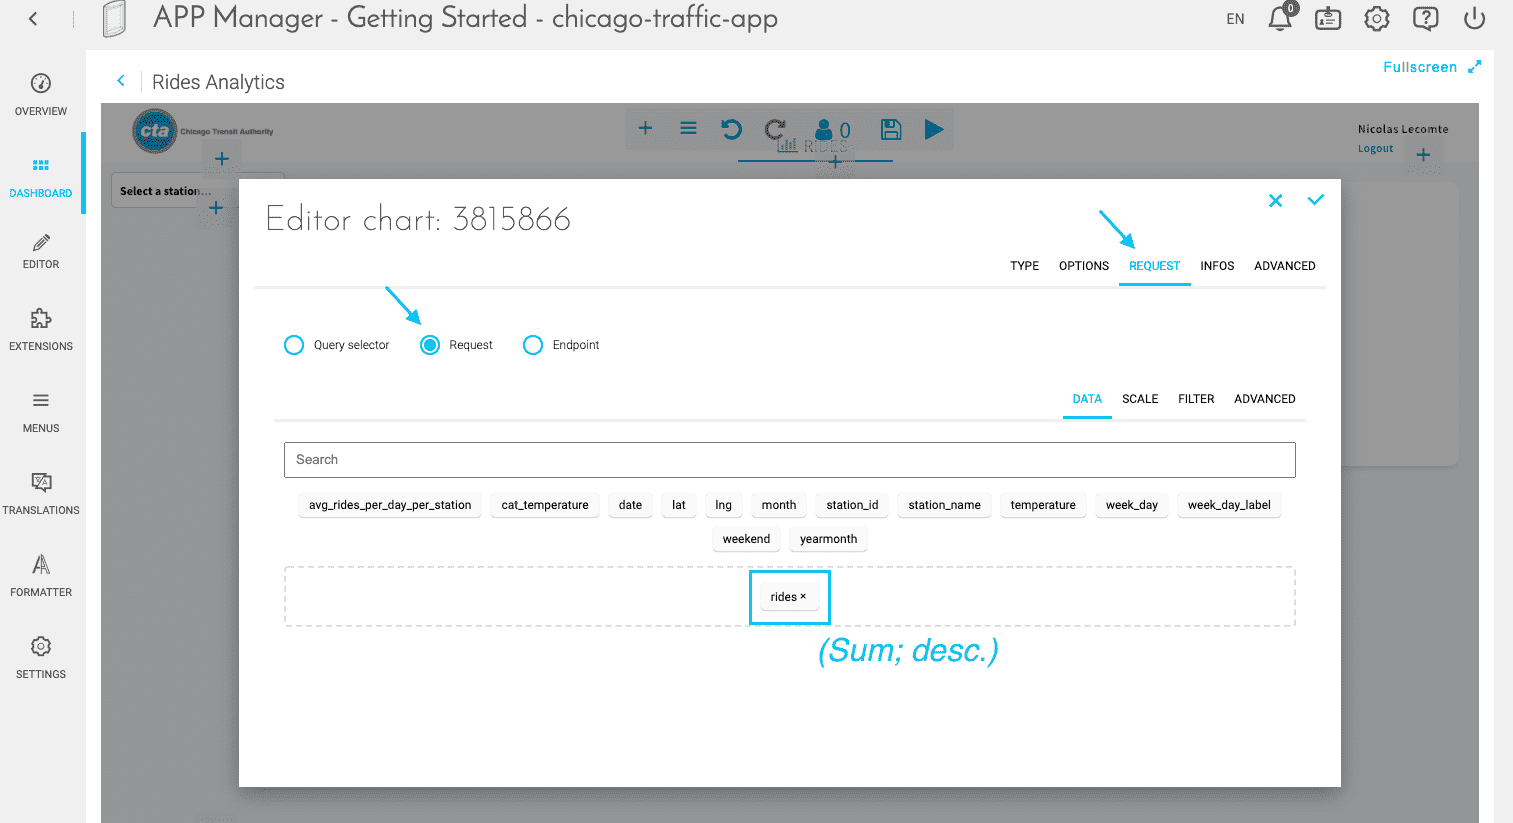
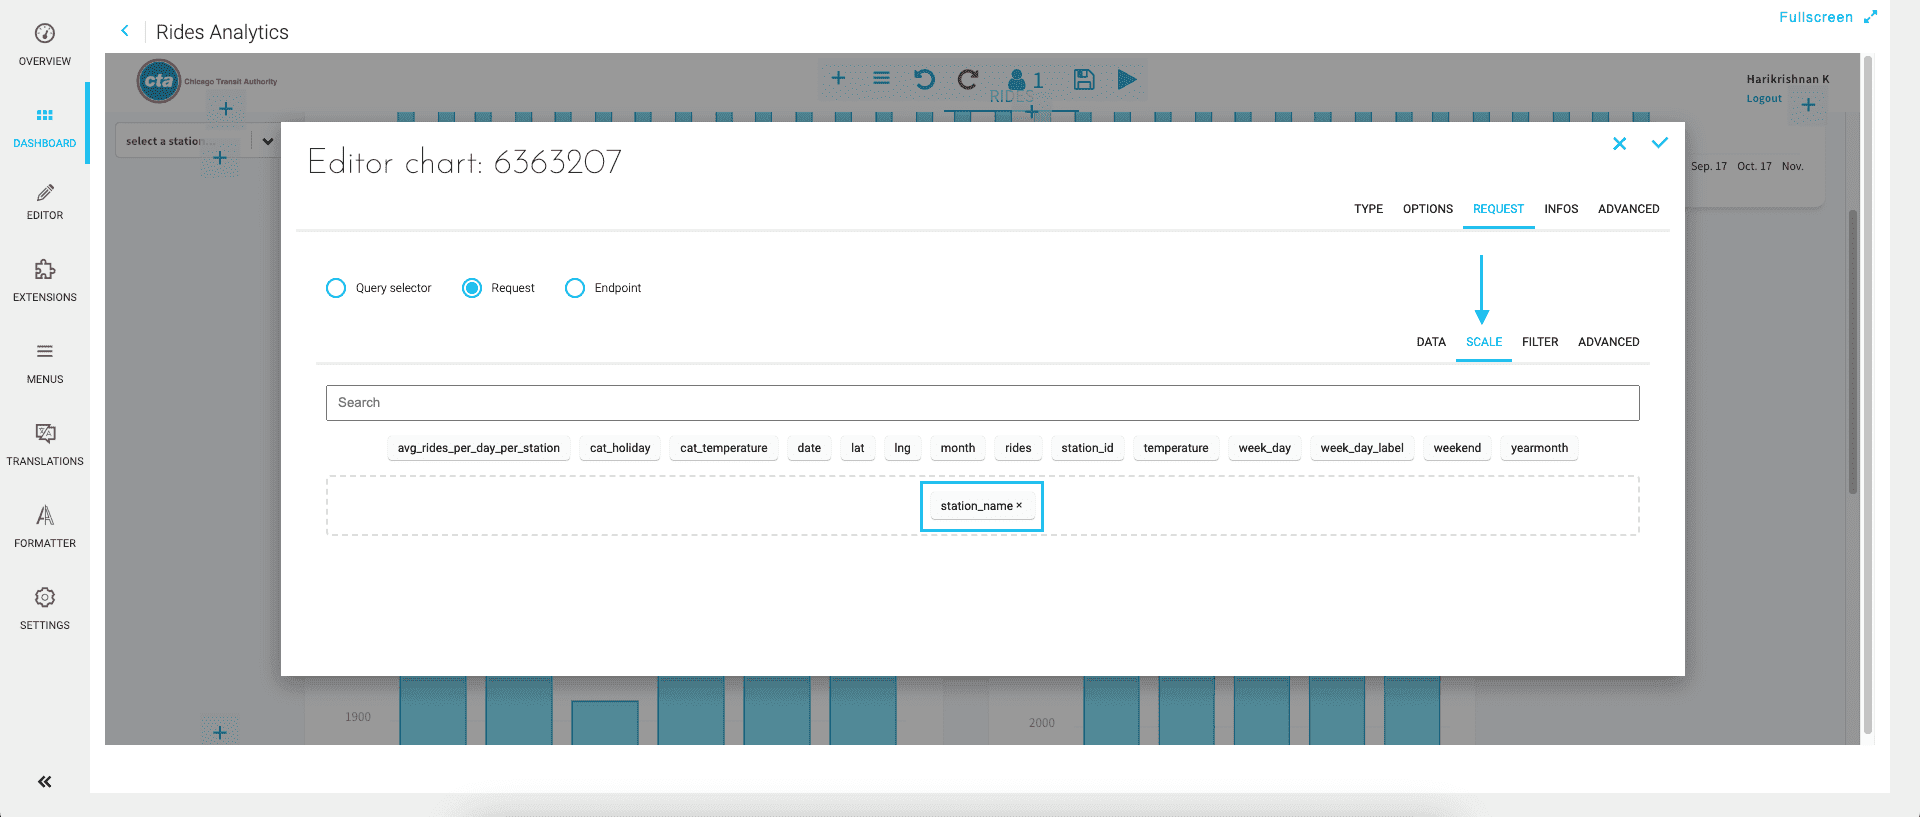
In the Request tab, choose the Request mode and enter rides as data (Sum and Descending) and station_name as scale.
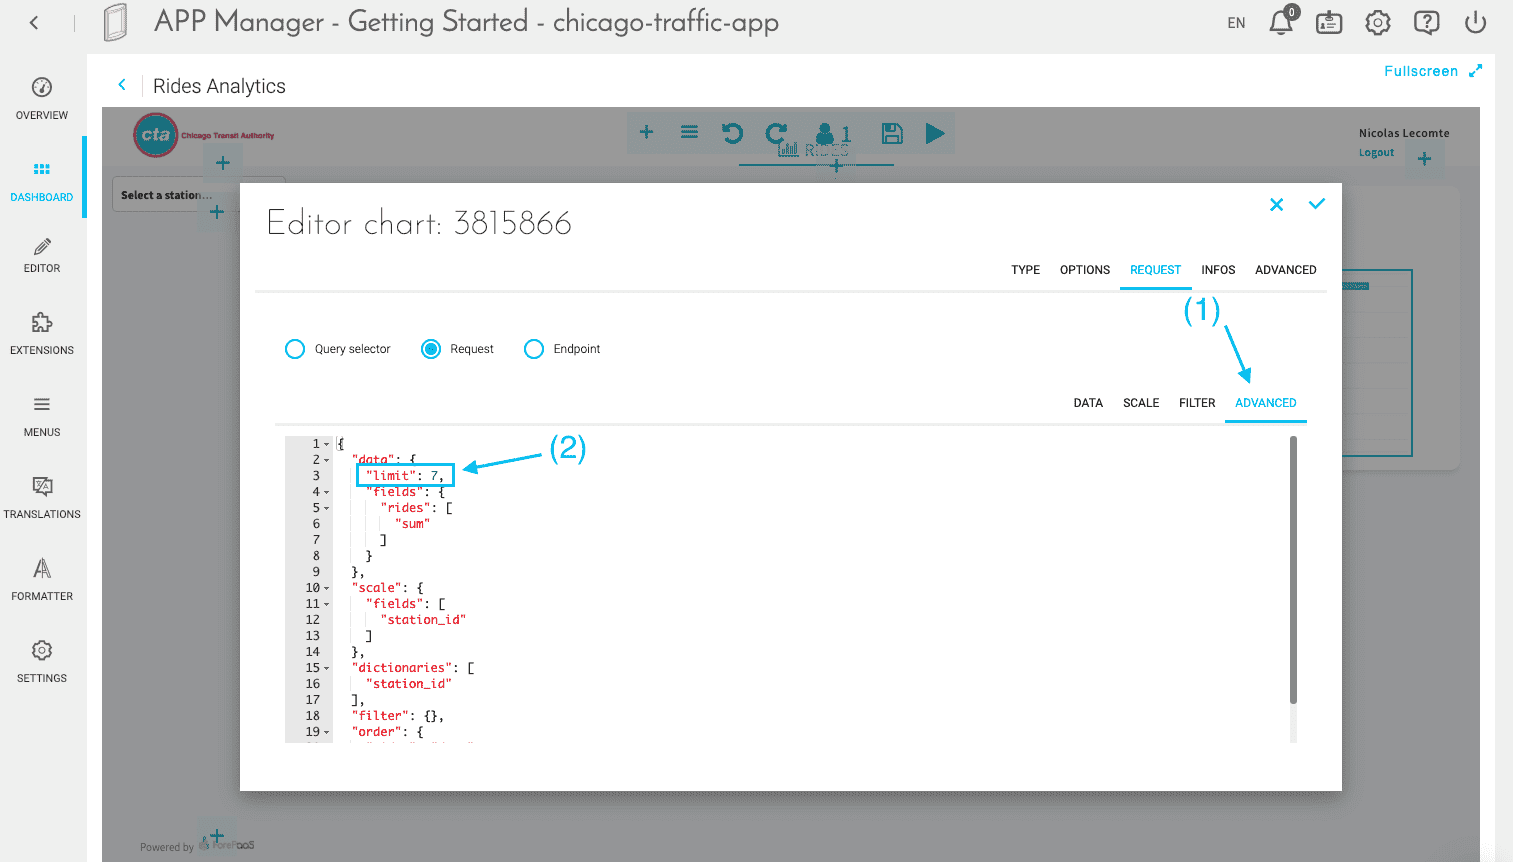
One last step! Queries can be fully customized using the advanced JSON editor. More specifically, you need to add a custom parameter to limit the number of stations to 7. To do that, head to the advanced mode of your query as shown below and simply add "limit":7, below line 2 in the "data" JSON object:
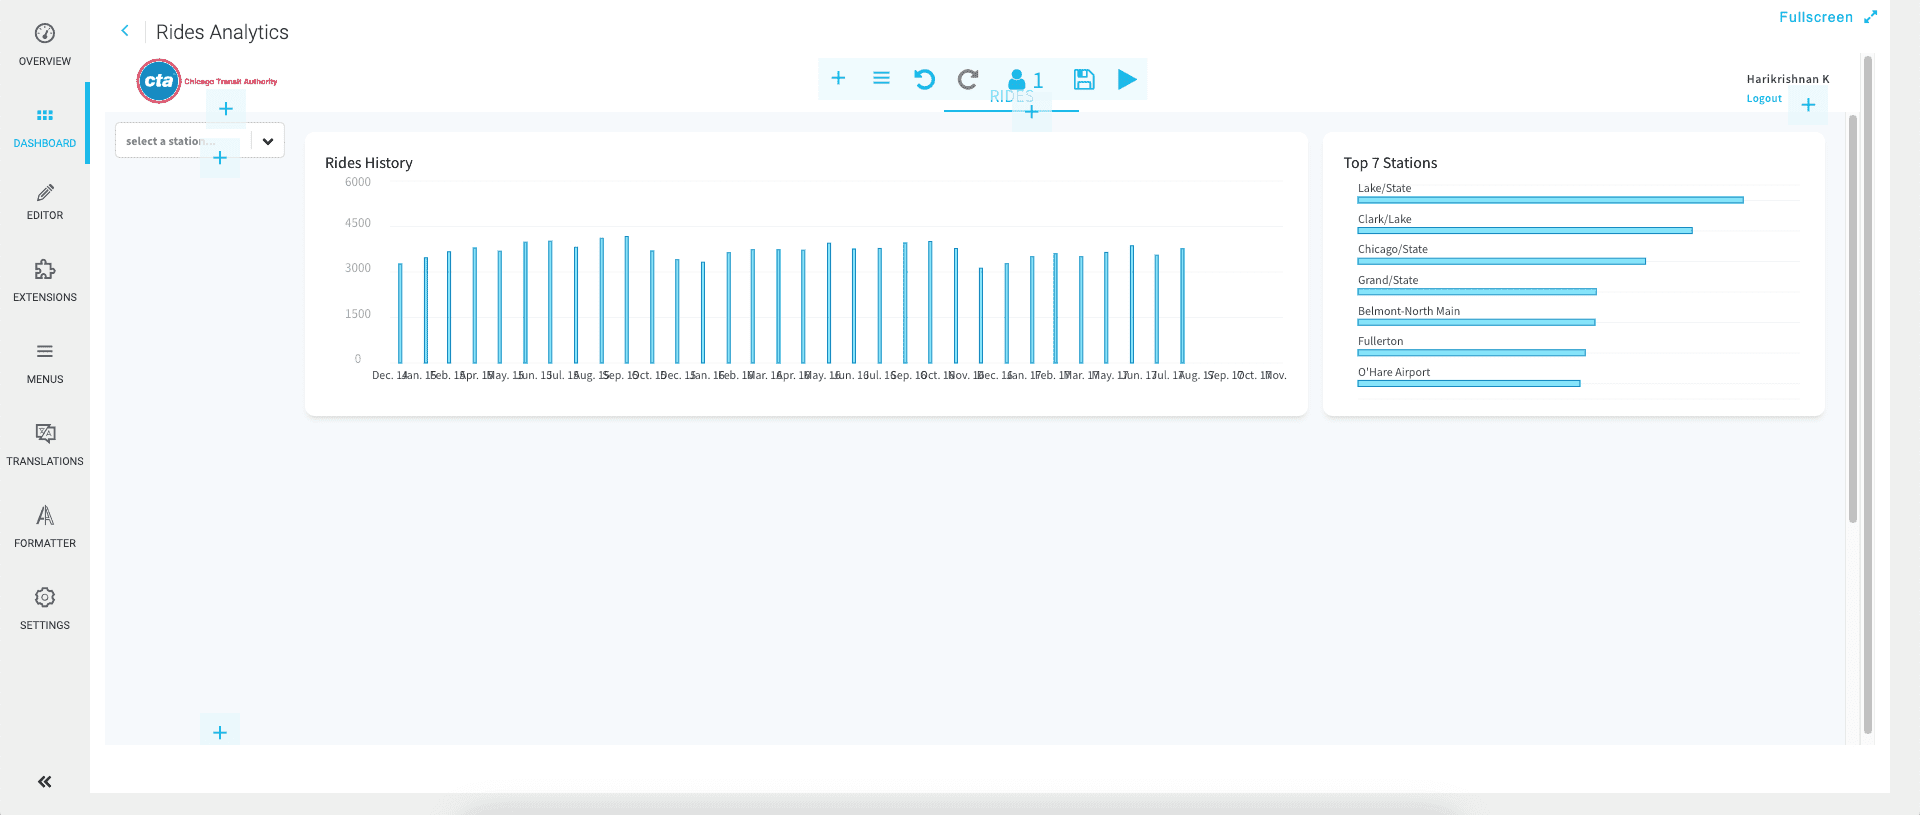
So far, your dashboard should look something like this. Don't forget to save.
Customizing further
There is a lot that you can do in the app builder to design your app exactly the way you want it.
Units
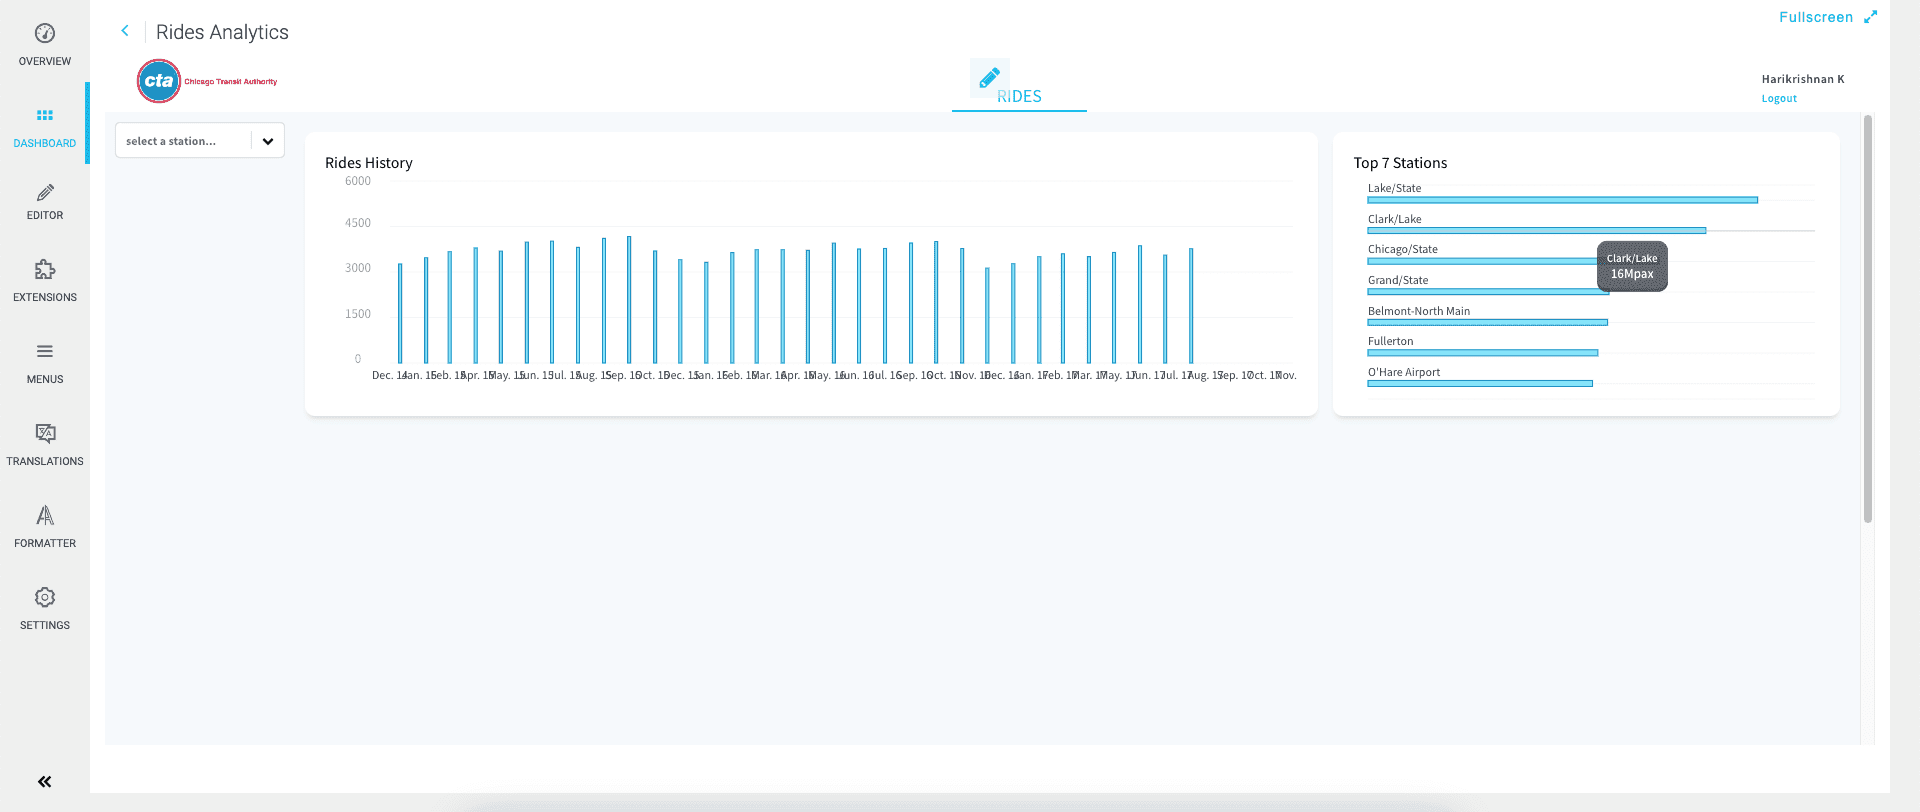
Click on the play button at the top of the dashboard to switch to read-only mode. Hover over the bars of the Top 7 stations chart.
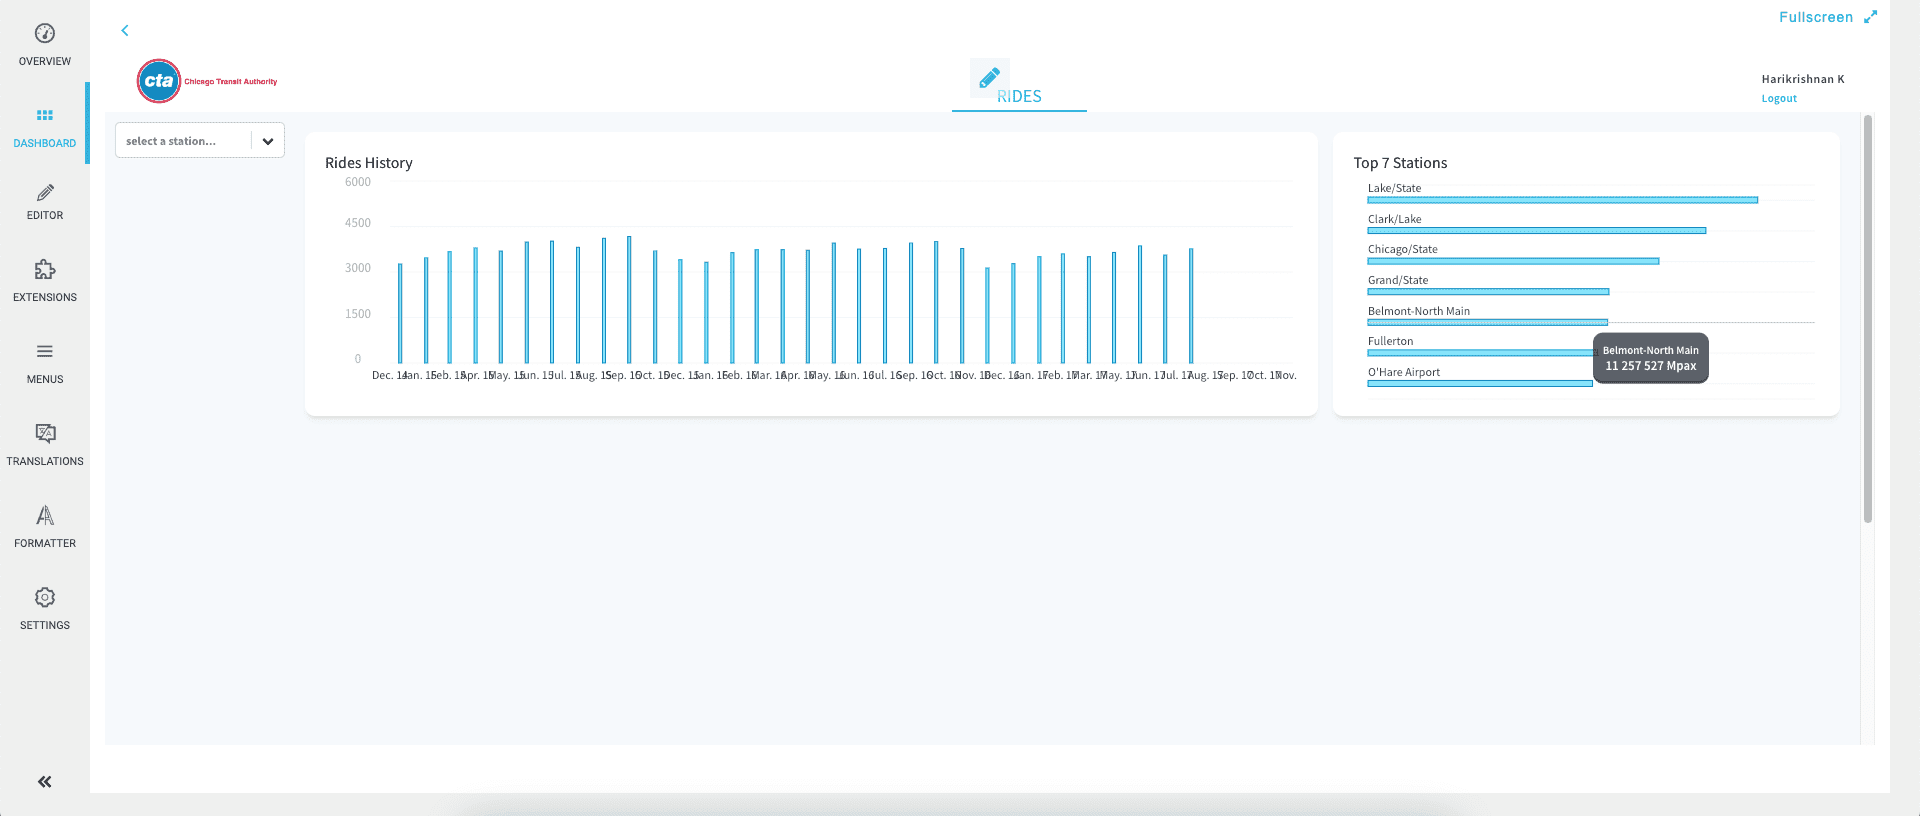
These units could be formatted in millions for better clarity. To do that, go to the Formatter tab. A measure called RIDES was already added by choosing the Getting Started template.
More generally, if you need to add a new measure, it must have the same name as the attribute that you are trying to format.
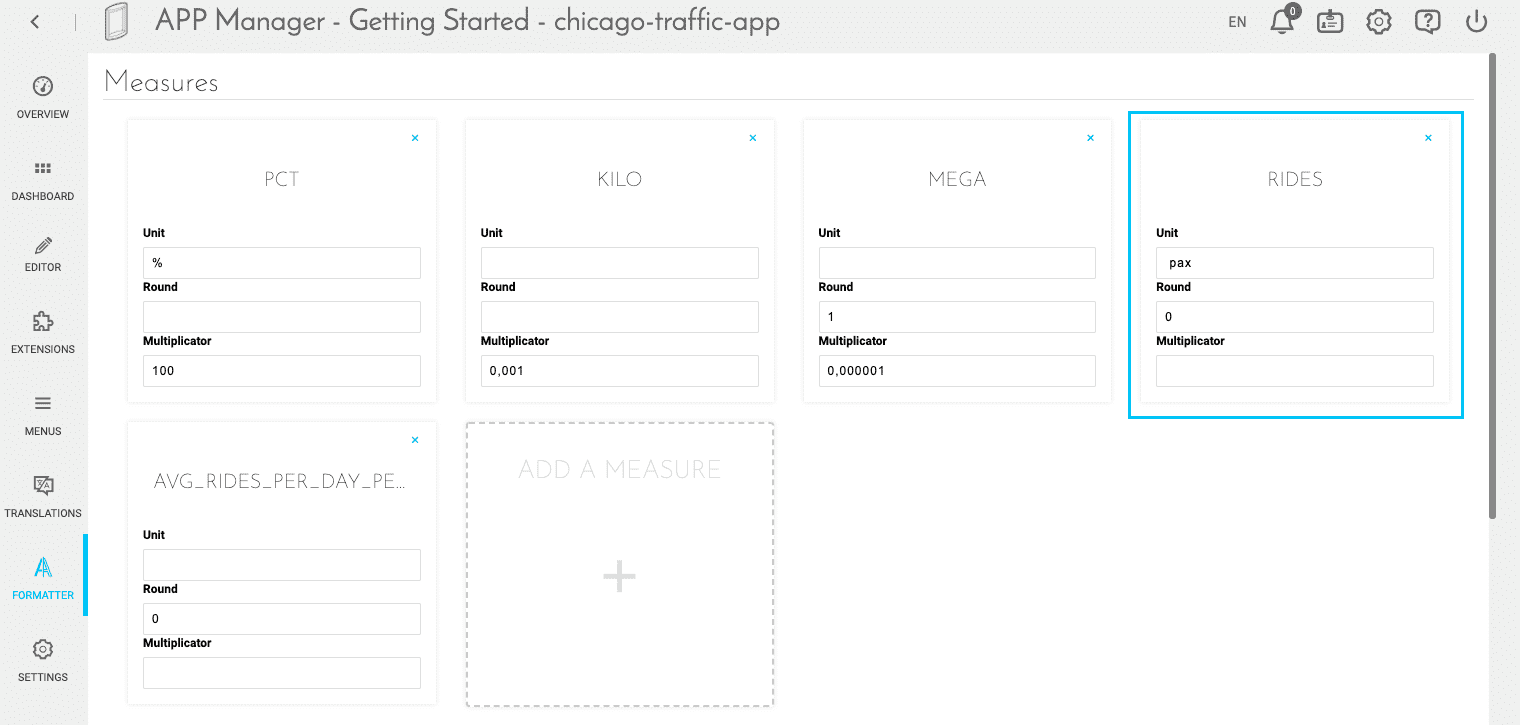
As for the formatting parameters, enter Mpax for unit, 0 for round (to display integers), and 0.000001 for multiplicator (to display millions).
The Formatter runs in autosave mode: your changes are saved as you type, and there is no Save button to click.
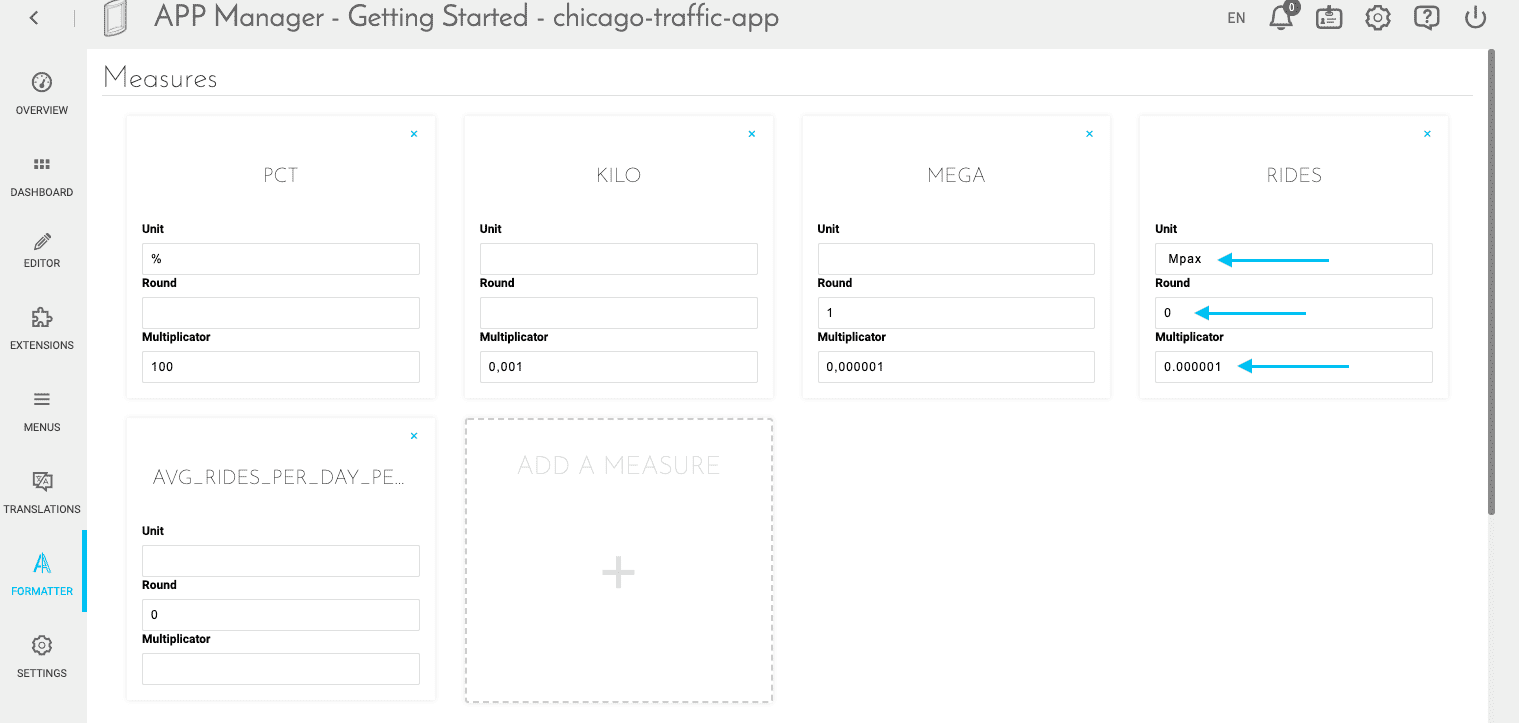
Here's the result:
Rebuild and deploy the new version of your app
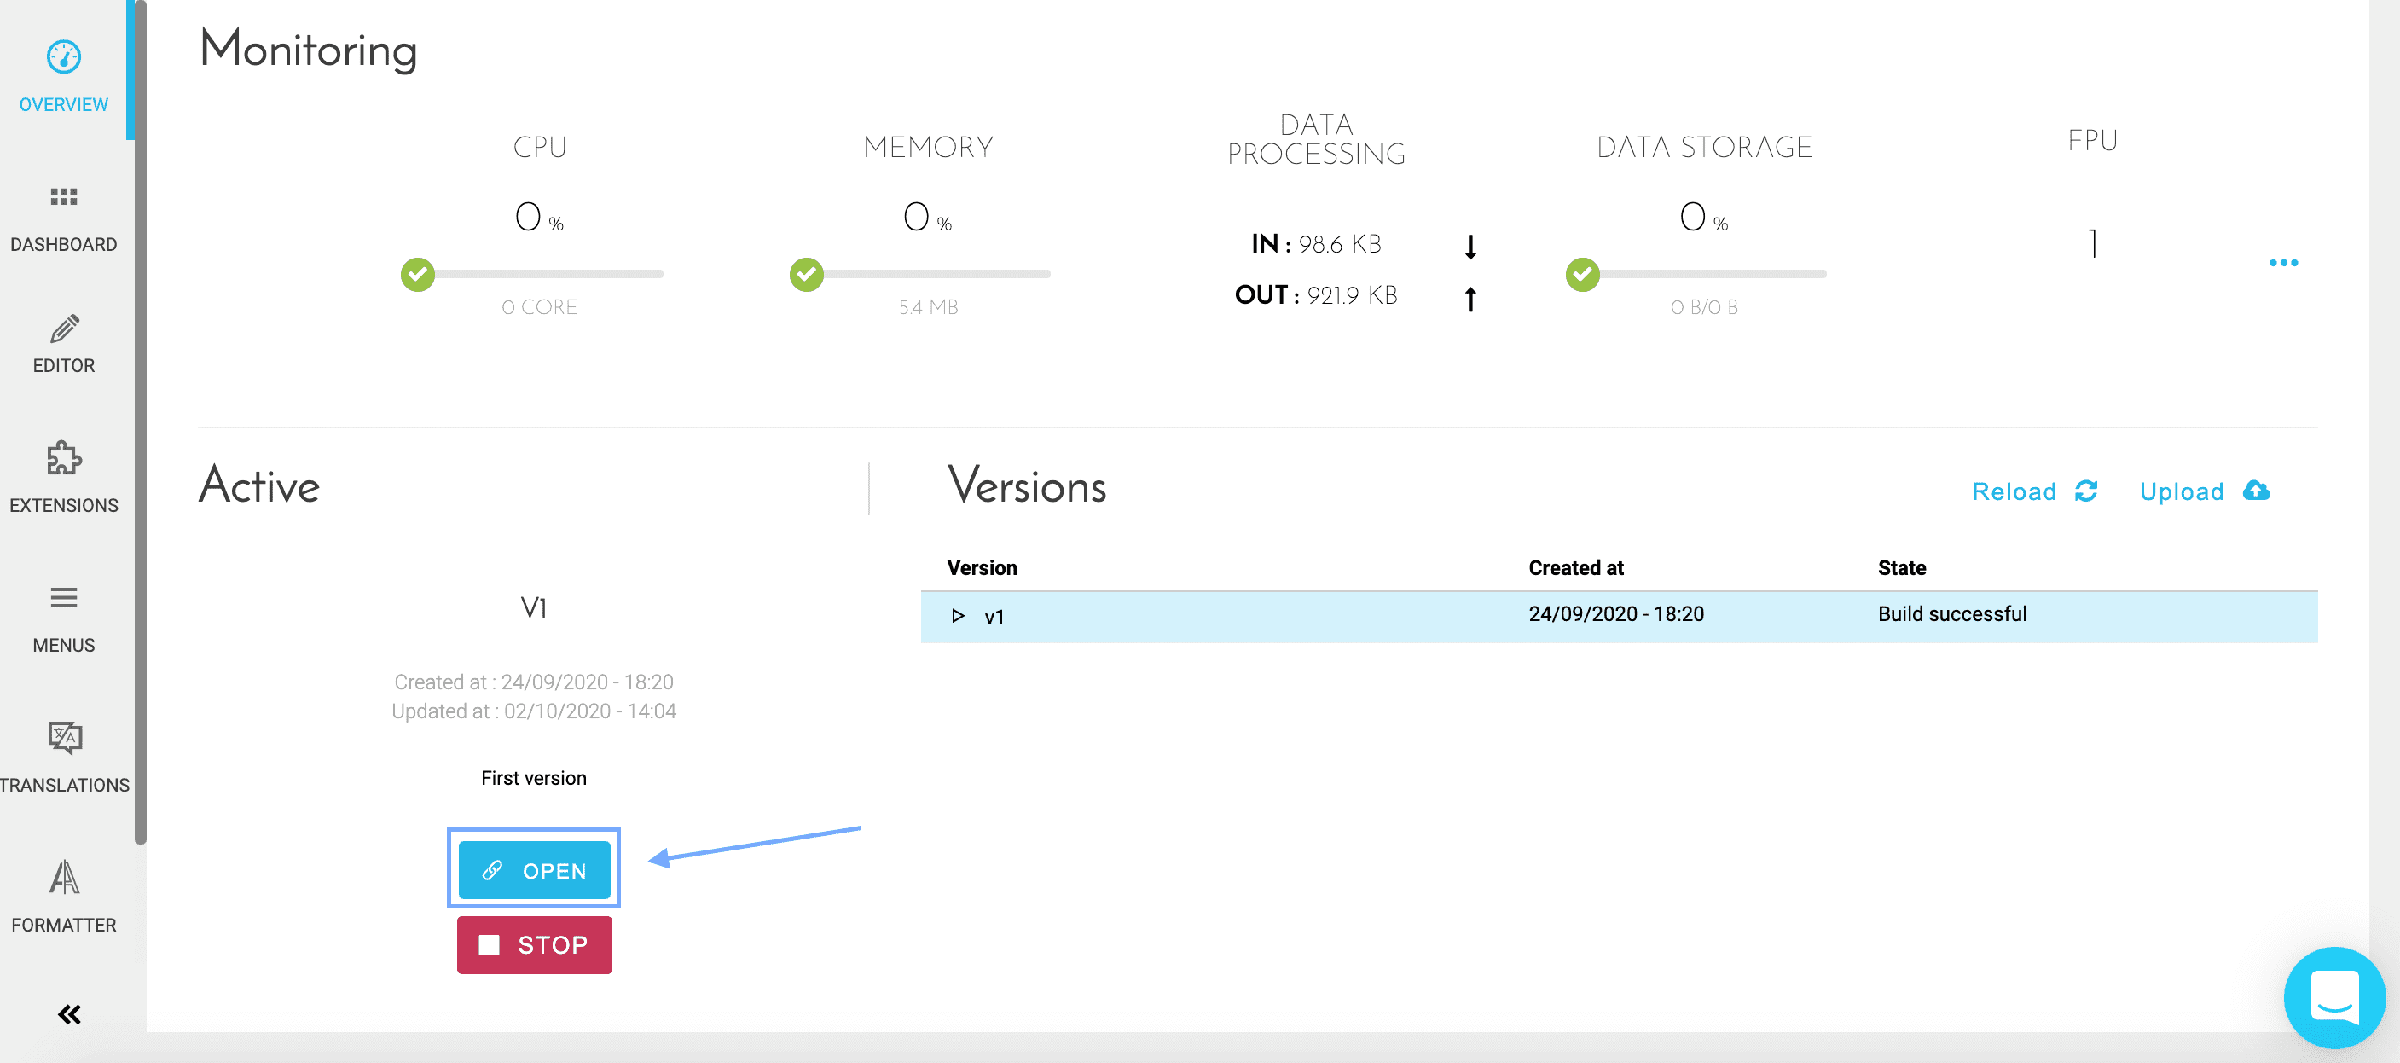
One last step: publish the recent dashboard changes to production. To do this, don't forget to save and then go back to the Overview tab of the Application Manager. You should first Stop the currently deployed application. As soon as it has shut down, click on Build, and then Deploy.
The build process usually takes a couple of minutes. If you're curious of what is going on or if the build fails: open the log console by expanding the version panel and inspect the logs. Feel free to send logs to our support team if you're not sure how to troubleshoot it yourself!
Your app is live and can now be accessed online!
The link can be obtained in the Overview tab by clicking on Open.
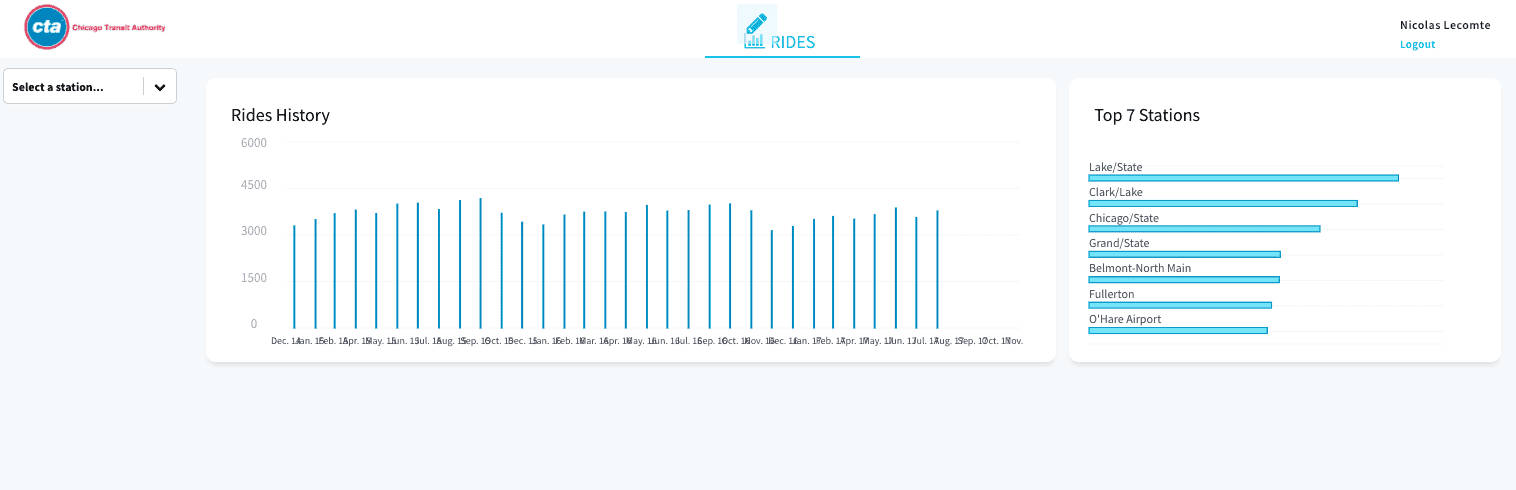
Your figures are now available in the application.
You've completed the Advanced application builder tutorial! You are now ready to build complex data applications on the Platform.
Obviously, you can come back to this tutorial at any time! We encourage you to check out the rest of the documentation to dive deeper into a specific component of the product when needed.
Also, don't hesitate to get in touch if you need anything, our support & product team is dedicated to helping you deliver faster any AI applications your have in mind.
Looking for more flexibility?
The visual app builder is great for getting started quickly, but if you are a developer looking for full control over your application code, we provide additional templates built with modern front-end frameworks.
These templates connect to the same Front API and let you build fully custom applications using your own development workflow.
Build a custom app with React, Vite & Shadcn
Go further
If you need training or technical assistance to implement our solutions, contact your sales representative or click on this link to get a quote and ask our Professional Services experts for a custom analysis of your project.
Ask questions, give your feedback and interact directly with the team building the Data Platform on the dedicated Discord channel.
If you need support with your OVHcloud services, create a request in our Help Centre.
Join our community of users.