Managed Hosting for WordPress - Retrieving and analysing your logs
Find out which logs your Managed Hosting for WordPress solution generates, how they are sent to Logs Data Platform, and how to query the available fields.
Objective
A log is an event recorded on a computer system (server, application, website, etc.). For a website, logs typically record each HTTP request received, the response returned, the client that issued the request, and how long the request took to serve.
Your Managed Hosting for WordPress solution generates logs for the websites it hosts and forwards them to Logs Data Platform, where you can store, visualise, and query them.
Unlike a raw log file, the logs sent to Logs Data Platform are split into individual fields (HTTP method, status code, client IP address, response time, etc.). This means you do not have to parse a single text line yourself: each piece of information is already available as a dedicated, searchable field.
Find out which logs are available for your Managed Hosting for WordPress solution and how to exploit them.
Requirements
- A Managed Hosting for WordPress solution with at least one website.
- Access to the .
- Basic knowledge of Logs Data Platform (EN).
Instructions
We provide this tutorial to help you with common tasks. However, we recommend contacting a specialist provider if you experience any difficulties. We will not be able to assist you with interpreting the logs generated by your Managed Hosting for WordPress solution. More information in the Go further section of this tutorial.
Available log kinds
Your Managed Hosting for WordPress solution forwards two distinct types of logs to Logs Data Platform:
Each entry is enriched with information identifying the website it relates to, so you can filter the logs of a single site even when several sites share the same stream:
service_id: the identifier of your Managed Hosting for WordPress service.website_id: the internal identifier of the website.fqdn: the domain name (virtual host) targeted by the request.
Viewing and forwarding your logs
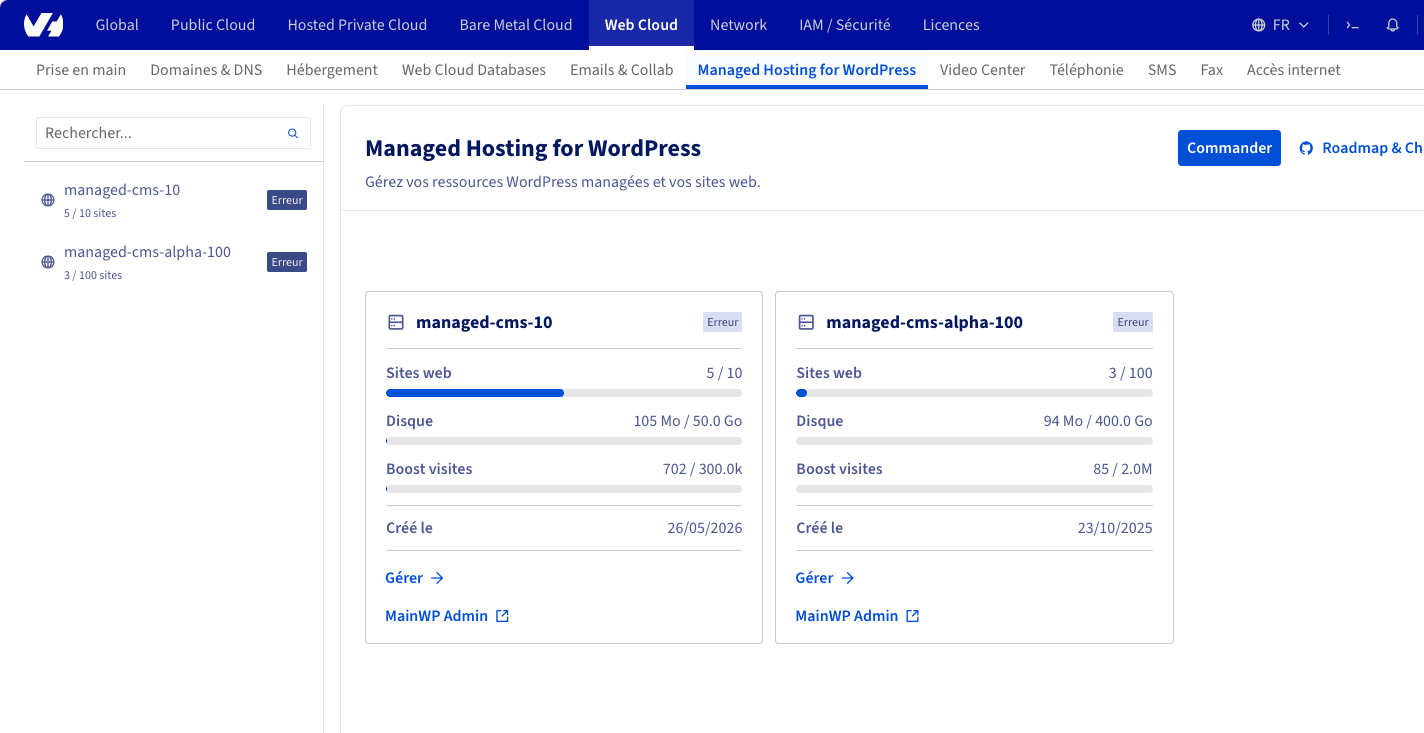
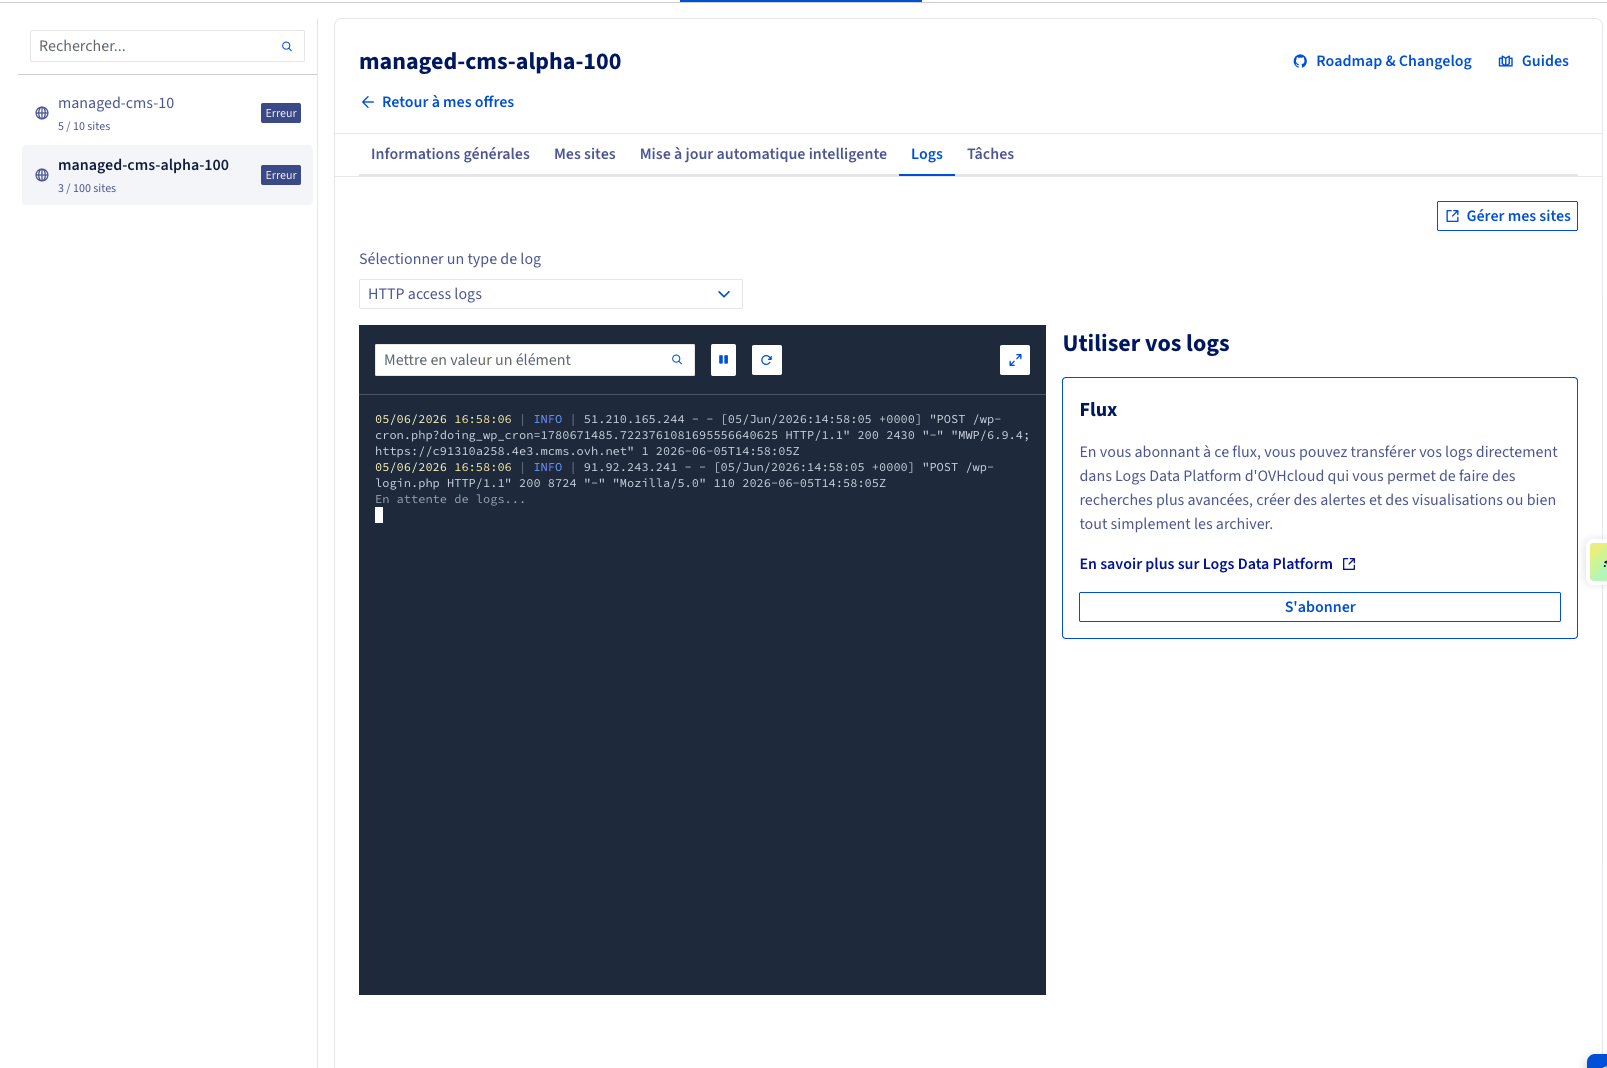
You can preview your most recent logs directly in the OVHcloud Control Panel and subscribe to Logs Data Platform to store, query, and visualise them. Click the tabs below to view each of the 2 steps.
Go to the page in your OVHcloud Control Panel, then click Manage under the resource concerned.
HTTP access log fields
For each HTTP request, the following fields are available. The field names follow the Logs Data Platform naming conventions (EN): the suffix indicates how the value is typed and indexed (_ip is geolocated, _int is an integer, _num is a number, _date is a date).
PHP-FPM log fields
The PHP-FPM kind is lighter and exposes the following fields:
Querying and analysing your logs
Once your logs reach Logs Data Platform, you can explore them through the Graylog web interface included with your solution, build dashboards, and set up alerts. For the basics, refer to the Quick start with Logs Data Platform (EN) guide.
Because the access logs are split into typed fields, you can run targeted searches directly from the Graylog search bar. A few examples:
- Display the requests of a single website:
- Find every server error (HTTP 5xx):
- Identify slow requests that took more than one second to serve:
- Monitor brute-force attempts on the WordPress login page:
- Filter traffic by the geolocated country of the client (provided by the
_ipsuffix):
The HTTP access logs are generated in UTC. Use the request_time_date field (an ISO 8601 date) or the time field for any date-based query, sorting, or histogram.
Go further
- Discover Managed Hosting for WordPress
- Introduction to Logs Data Platform (EN)
- Quick start with Logs Data Platform (EN)
- Logs Data Platform field naming conventions (EN)
For specialised services (SEO, development, etc.), contact OVHcloud partners.
Join our community of users.