
Introduction to Public Cloud Logs
Discover how Public Cloud services generate, collect, and forward logs to Logs Data Platform across OVHcloud services
Objective
This guide helps you understand the concepts and usage of logging in OVHcloud Public Cloud. It explains how logs are generated, collected, and consumed, and provides links to detailed guides for subscribing to logs from each Public Cloud service (Compute, Block Storage, Load Balancer, etc.).
What are Public Cloud Logs?
Public Cloud services generate logs that can help you monitor, troubleshoot, and analyse your cloud infrastructure.
Each service may offer different types of logs, known as kinds (e.g., access, audit, error), which can be consumed and stored according to your needs.
Requirements
- A Public Cloud project in your OVHcloud account.
- A Logs Data Platform account.
- At least one Stream created inside this account.
- At least one instance of a product compatible with Public Cloud logs (see the list below).
Use cases
Application troubleshooting
Public Cloud logs help you troubleshoot application and infrastructure issues by giving access to logs generated by your services. You can filter and search these logs to identify anomalies and errors, which makes diagnosing and resolving problems more efficient. In distributed cloud architectures, logs from different services can be correlated to get a complete view of your environment.
Security and data compliance
Public Cloud logs help you detect security incidents, track administrative actions, and support compliance with certifications and regulatory requirements. By keeping a record of operations and access events, logs provide essential evidence for audits and security investigations.
Depending on the service and the log destination you choose, access to logs can be restricted using fine-grained permissions. This allows you to control who can view or manage specific logs, strengthening your security posture and improving overall data governance.
Infrastructure monitoring
Public Cloud logs provide valuable insights into the health and behaviour of your infrastructure. By analysing service and system logs, you can detect abnormal patterns, errors, or performance issues and react before they impact your workloads or users.
Depending on the tools and destinations you use to consume your logs, you can build monitoring workflows such as alerts or visualizations to better understand the activity of your Public Cloud services and share this information across your teams.
Compatible Public Cloud services
The following table lists the Public Cloud services that currently provide logs and explains where to find the corresponding guides to enable or retrieve them. Availability and capabilities may vary depending on the service. This list will be updated as new services become compatible.
OVHcloud Control Panel Access
- Direct link:
- Navigation path:
Public Cloud> Select your project > Select a service >Logs
Instructions
On the product side
On Public Cloud services that provide logging capabilities, you can access logs from the OVHcloud Control Panel through a dedicated Logs tab. This section allows you to view available logs and configure how they are collected or forwarded. This tab shows the two main components: a live-tail panel and a subscription panel.
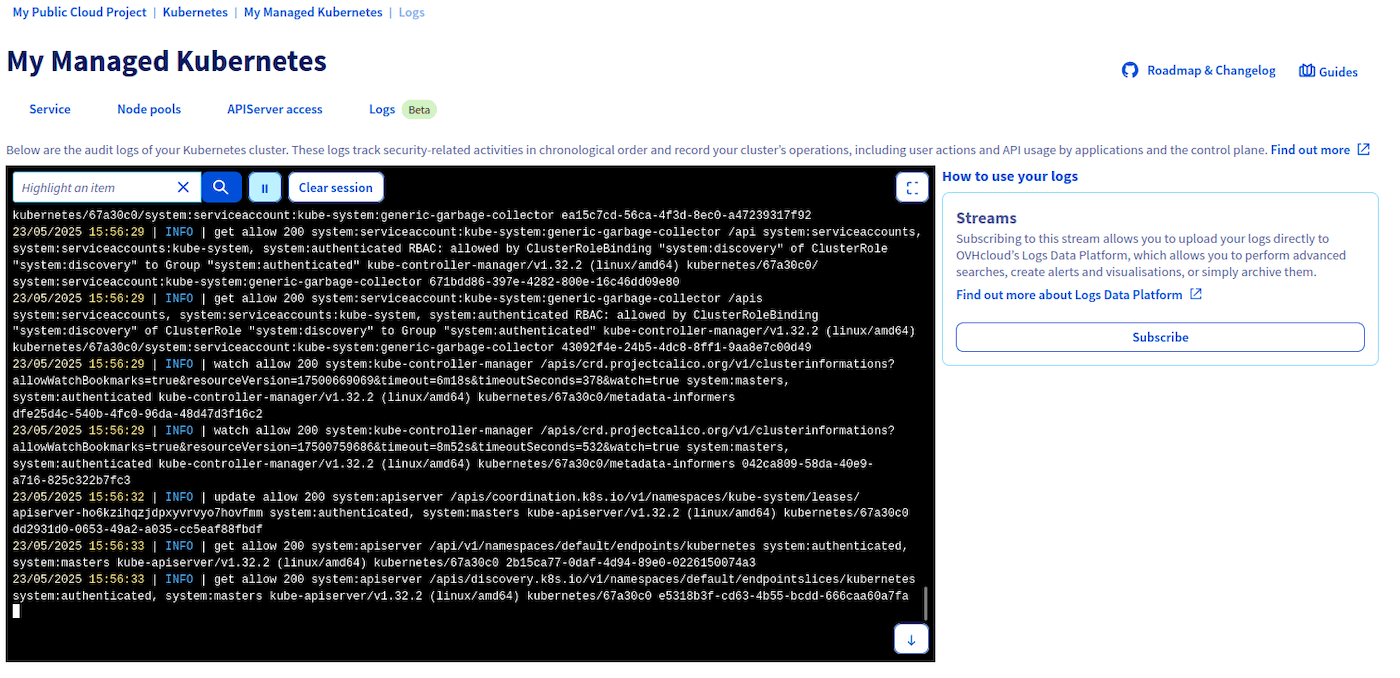
Live-tail panel
On the left side, the live-tail panel lets you see the logs of this service in real time. It is useful to have a quick overview of the ongoing activity on this service.
It lets you pause/play the live-tail, clear the current session, scroll, and search:

Subscription panel
On the right side, the subscription panel lets you subscribe to this service's logs to make them available in your Logs Data Platform account, in the data stream(s) of your choice. This panel displays all your active log subscriptions for this service and lets you create new ones.
Click Subscribe (or Subscribe to another data stream if you already have subscriptions). You land on this page:
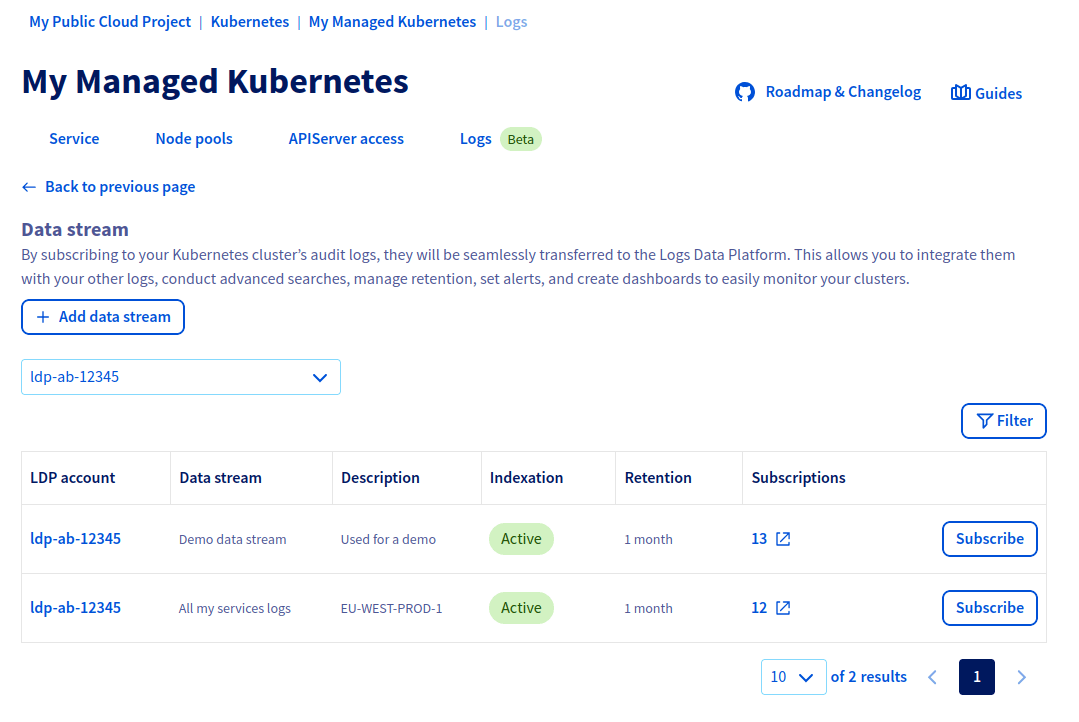
This is where you have to select the Logs Data Platform stream in which you want this service's logs to be available. Using the top left dropdown list, select your Logs Data Platform account. The datagrid in the center displays all the data streams in the selected Logs Data Platform account and shows you information about each data stream: its name/description, its retention and if indexing is enabled. It also shows you if this data stream already has some other active logs subscriptions.
The last column contains the Subscribe and Unsubscribe buttons. Click Subscribe to start sending logs to the selected data stream, or Unsubscribe to stop.
You can choose to create multiple subscriptions for a given service, to have its service logs available in multiple data streams. This is useful for use cases detailed later in this guide.
- Only the service logs generated after the subscription creation will be available in your data stream.
- If you choose to unsubscribe, the logs already sent to your data stream will remain; they will only be deleted when they reach your stream's configured retention. You just won't see newly generated logs.
- Logs Data Platform is pay-as-you-go: you pay for the amount of logs sent in your data stream. If you subscribed to a product that generates no logs (because it has no activity), you won't pay anything.
Logs kinds
A Public Cloud service can offer several log types, called kinds. When a product has more than one log kind, the live-tail & subscriptions panels become contextualised to the selected kind:
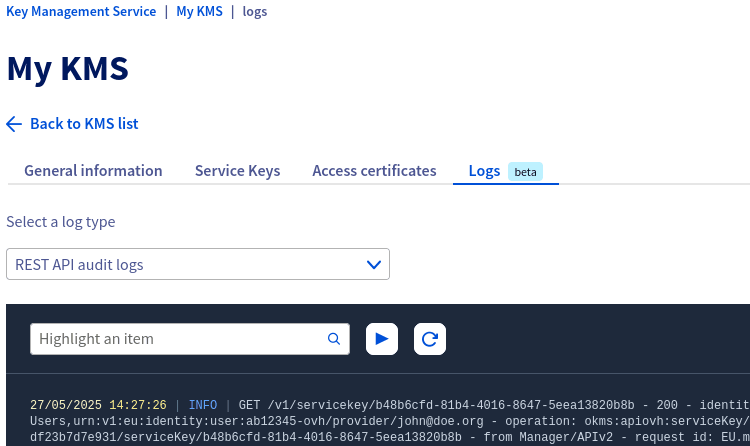
In this example, both the live-tail display and the subscriptions listed in the right panel relate to the REST API audit logs kind. Selecting another kind in the top dropdown list displays different live-tail content and subscriptions.
This division of a product's logs into several kinds provides you more flexibility. For example if a product has many kinds (e.g. access, audit, error and ssh) and you are only interested in audit logs, you can subscribe only to the audit kind and skip the others. Another example: you are interested in audit logs and error logs, but you want to send these logs in two different data streams: that's possible by creating two subscriptions based on two different kinds targeting two different data streams.
We cover this use case later in this guide.
On the Logs Data Platform side
Now that you have created logs subscription(s), you can consume these logs the way you want in your Logs Data Platform data stream. Depending on your needs, you can configure your data stream in different (non-exclusive) ways. For instance:
- Enabling indexing to benefit from the OpenSearch/Graylog feature set.
- Enabling long-term storage to safely keep your logs for years.
- Enabling web-socket to consume your logs from a third-party software, such as ldp-tail.
All the possible ways to consume your logs are summarized in the Introduction to Logs Data Platform.
In the case of Public Cloud logs, all the "Log Generation" and "Log Ingestion" are managed by OVHcloud. You only have to care about the "Storage" and "Query and visualization" parts.
You can also manage your logs subscription from a data stream point of view. To do so, go to the Logs Data Platform section of the , select a service and click on the Data stream tab. In the table listing your streams you can see a Subscriptions column displaying how many logs subscriptions target a given stream.
In this table, click the ... button then click Manage subscriptions. The next page will list all the logs subscriptions targeting this data stream:
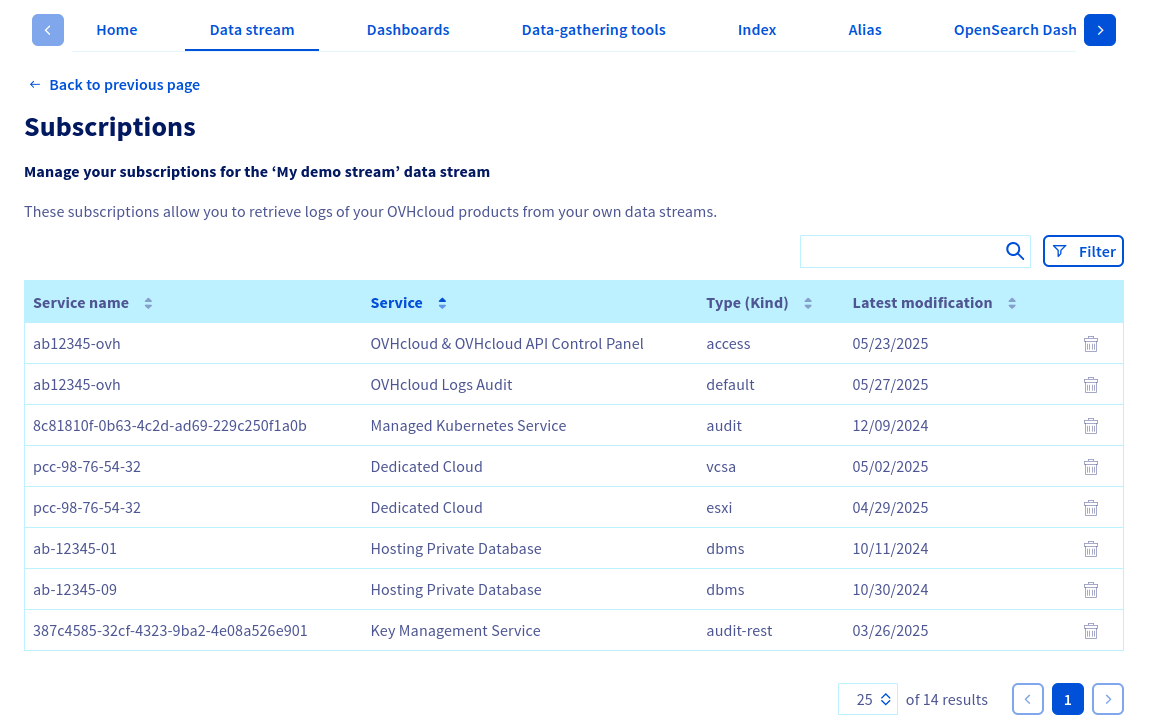
For each subscription, you can see the type of service it comes from, the service name and the subscribed logs kind.
You can also delete a logs subscription from this view by clicking the corresponding bin icon.
Working with the API
To ease your integration jobs with Public Cloud logs, we made the API endpoints consistent across all Public Cloud services. This means all compatible products expose the same set of API endpoints, with the same suffixes, the same payloads and the same responses. The available endpoints are the following:
Public Cloud logs and the IAM cross-identity service delegation
You can face use cases where the product you want logs from and the Logs Data Platform service are not owned by the same OVHcloud account. Example:
- Alice is the owner of a Managed Kubernetes Service instance.
- Bob is the owner of a Logs Data Platform instance.
- Alice wants her Managed Kubernetes Services logs to be available in Bob's Logs Data Platform data stream.
This is possible thanks to OVHcloud IAM:
- Bob needs to create an IAM policy to allow Alice's identity to use the
ldp:apiovh:output/graylog/stream/forwardToIAM action on his Logs Data Platform data stream. - Then Alice will be able to use the
POST /cloud/project/{serviceName}/kube/{kubeId}/log/subscriptionAPI endpoint, and give Bob'sstreamIdin this endpoint payload.
You can find more information about IAM policies in the How to use IAM policies using the OVHcloud Control Panel guide.
Interesting strategies
The Public Cloud logs model gives you flexibility in how you gather, isolate, and consume logs. In this section we will see some common patterns. These are just examples, they aren't an exhaustive list of all the Public Cloud logs configuration possibilities.
Many products to One data stream, per environment
In this example let's say you have a tech stack composed of many Public Cloud services. This stack is deployed on multiple environments (development, production). One interesting strategy could be to send each environment's logs to a different data stream, and configure these 2 data streams in a different way:
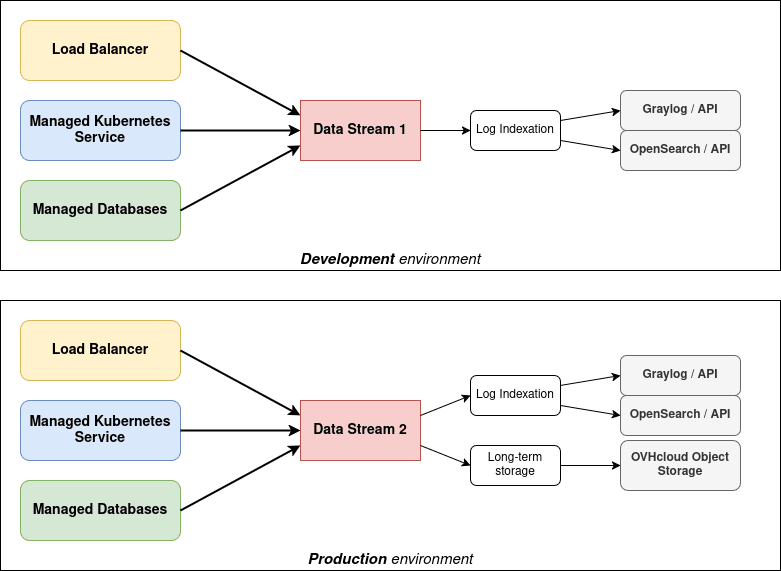
In the configuration above:
- All the logs of your development environment are available in a data stream. Only the indexing feature is enabled on this data stream.
- All the logs of your production environment are available in another data stream. The indexing and long-term storage feature are both enabled.
This means that:
- Your development environment logs won't be long-term stored, as you probably don't need it and don't want to pay for it.
- Your production environment logs will be stored in a dedicated data stream, making it easier for you to configure alerts or dashboards based on this stream.
Many products to Many data streams
Let's take the same example again, where you have a tech stack made of several Public Cloud services. But in this case you have multiple teams, each one working on a different component. For security reasons you want the team A to access the Load Balancer logs but not the Managed Databases logs.
Also you have a Security team that needs to access all the audit logs of each component. We can imagine a setup such as the following one:
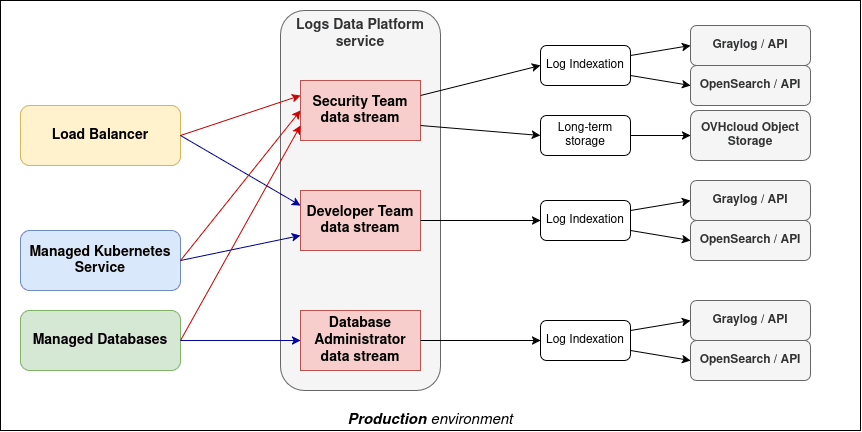
In the configuration above:
- All the Load Balancer & Managed Kubernetes application logs are sent to a data stream (blue arrow).
- All the Managed Databases application logs are sent to another data stream (blue arrow).
- All their audit logs are sent to another data stream (red arrow).
This means that:
- You can grant your Security Team to see only the data stream containing all the audit logs of all the components of your tech stack.
- You can grant your Developer Team to see only the data stream containing the Load Balancer / Managed Kubernetes logs.
- You can grant your Database Administrator Team to see only the data stream containing your Managed Databases logs.
- You can configure the indexing/long-term storage/etc. as you wish on each of these streams. You can also set different retentions for each stream.
Go further
- Getting Started: Quick Start
- Documentation: Introduction to Logs Data Platform
- Create an account: Try it!
Join our community of users.