You can use the Reset cluster function in the Public Cloud section of the to reinitialize your cluster before following this tutorial.
Requirements
This tutorial presupposes that you already have a working OVHcloud Managed Kubernetes cluster, and some basic knowledge of how to operate it. If you want to know more on those topics, please look at the OVHcloud Managed Kubernetes Service Quickstart.
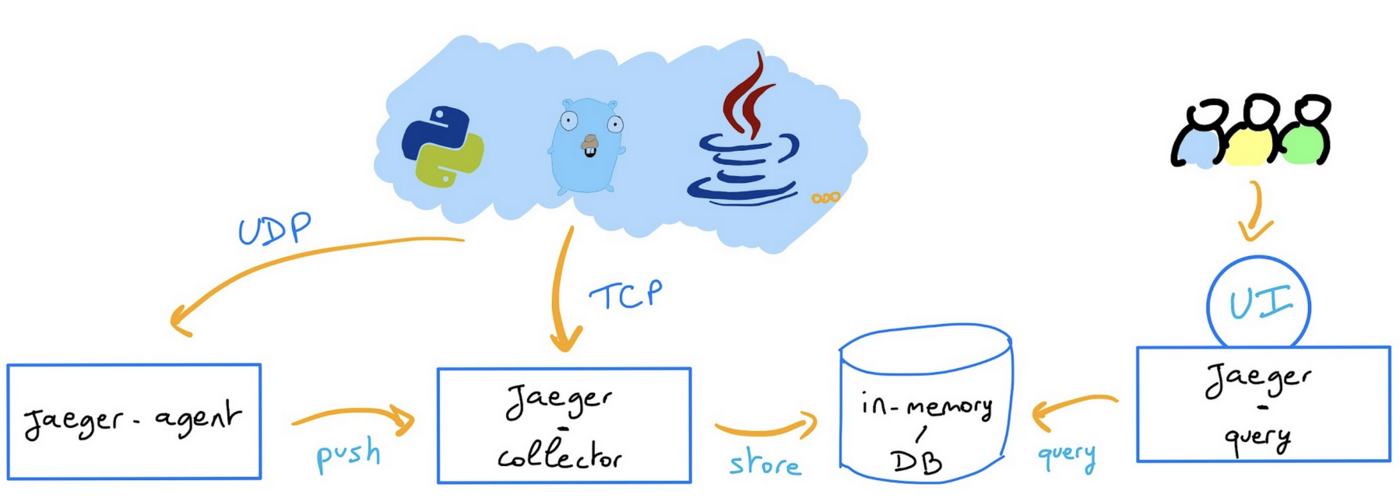
In this guide we will show you how to deploy Jaeger as distributed tracing platform backend and then how to deploy your instrumented application that will send their traces to Jaeger.
These commands will add the Jaeger Helm repository to your local Helm chart repository and update the installed chart repositories:
$ helm repo add jaegertracing https://jaegertracing.github.io/helm-chartshelm repo update"jaegertracing" has been added to your repositoriesHang tight while we grab the latest from your chart repositories......Successfully got an update from the "sealed-secrets" chart repository......Successfully got an update from the "prometheus-community" chart repositoryUpdate Complete. ⎈Happy Helming!⎈
The Jaeger repository provides two charts: jaeger and jaeger-operator. For the guide, you will deploy the jaeger-operator chart, which makes it easy to configure a minimal installation.
To learn more about the Jaeger Operator for Kubernetes, consult the official documentation.
Install the latest version of Jaeger with helm install command:
Thanks to the variable overriding rbac.clusterRole=true, you ask the operator to watch all namespaces.
Check the Jaeger Operator is running:
kubectl get pod -n observability
$ kubectl get pod -n observabilityNAME READY STATUS RESTARTS AGEjaeger-operator-67f8dd68c9-5qj26 1/1 Running 0 3m5s
The simplest possible way to create a Jaeger instance is by creating a YAML file that will install the default AllInOne image. This “all-in-one” image includes: agent, collector, query, ingester and Jaeger UI in a single pod, using in-memory storage by default.
For this guide you will deploy Jaeger components through this simple way, which can be used for development, testing and demo purposes but for production strategy you can read the official documentation.
Once the jaeger-operator pod in the namespace observability is ready, create a jaeger.yaml file with the following content:
In order to link your application to the Jaeger backend you need to use a tool like OpenTelemetry.
OpenTelemetry is a collection of tools, APIs, and SDKs. Useful to instrument, generate, collect, and export telemetry data (metrics, logs, and traces) to help you analyze your software’s performance and behavior.
OpenTelemetry integrates with popular libraries and frameworks such as Spring, Express, Quarkus, and with a lot of languages. Go to the documentation to see how to integrate your application.
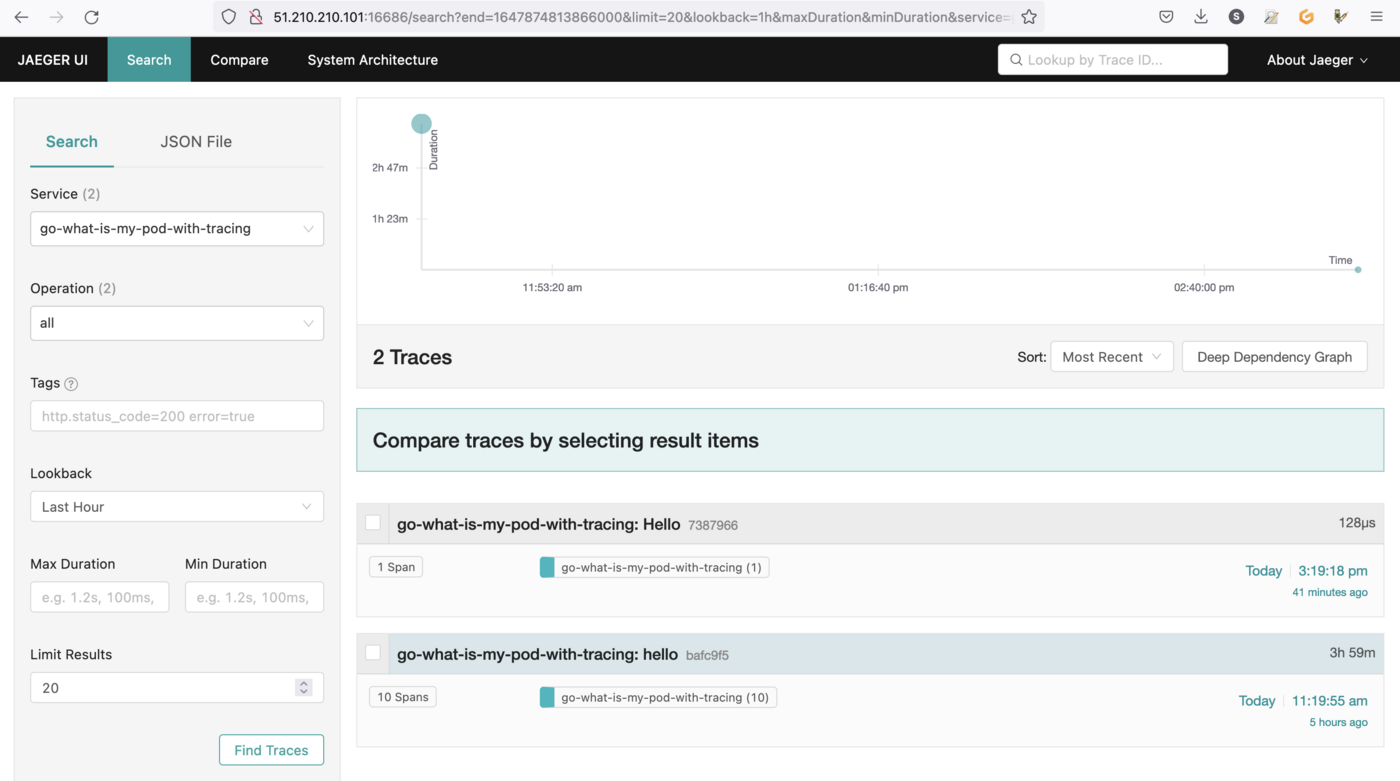
For this guide you will deploy a Golang application, instrumented with OpenTelemetry, that will send traces to a provider: your Jaeger collector.
Our main.go file contains:
the import of the OpenTelemetry dependencies,
a tracerProvider method that initiates a connection to a Jaeger provider
a main() method that connects to the Jaeger collector you previously deployed and creates and sends a span each time the / HTTP route will be called
package mainimport ( "context" "fmt" "log" "net/http" "os" "time" "go.opentelemetry.io/contrib/instrumentation/net/http/otelhttp" "go.opentelemetry.io/otel" "go.opentelemetry.io/otel/attribute" "go.opentelemetry.io/otel/exporters/jaeger" "go.opentelemetry.io/otel/sdk/resource" tracesdk "go.opentelemetry.io/otel/sdk/trace" semconv "go.opentelemetry.io/otel/semconv/v1.7.0")const ( service = "go-what-is-my-pod-with-tracing" environment = "development" id = 1)func tracerProvider(url string) (*tracesdk.TracerProvider, error) { // Create the Jaeger exporter exp, err := jaeger.New(jaeger.WithCollectorEndpoint(jaeger.WithEndpoint(url))) if err != nil { return nil, err } tp := tracesdk.NewTracerProvider( // Always be sure to batch in production. tracesdk.WithBatcher(exp), // Record information about this application in a Resource. tracesdk.WithResource(resource.NewWithAttributes( semconv.SchemaURL, semconv.ServiceNameKey.String(service), attribute.String("environment", environment), attribute.Int64("ID", id), )), ) return tp, nil}func main() { // Tracer tp, err := tracerProvider("http://jaeger-collector-headless.default.svc.cluster.local:14268/api/traces") if err != nil { log.Fatal(err) } // Register our TracerProvider as the global so any imported // instrumentation in the future will default to using it. otel.SetTracerProvider(tp) ctx, cancel := context.WithCancel(context.Background()) defer cancel() // Cleanly shutdown and flush telemetry when the application exits. defer func(ctx context.Context) { // Do not make the application hang when it is shutdown. ctx, cancel = context.WithTimeout(ctx, time.Second*5) defer cancel() if err := tp.Shutdown(ctx); err != nil { log.Fatal(err) } }(ctx) tr := tp.Tracer("component-main") ctx, span := tr.Start(ctx, "hello") defer span.End() // HTTP Handlers helloHandler := func(w http.ResponseWriter, r *http.Request) { // Use the global TracerProvider tr := otel.Tracer("hello-handler") _, span := tr.Start(ctx, "hello") span.SetAttributes(attribute.Key("mykey").String("value")) defer span.End() podName := os.Getenv("MY_POD_NAME") fmt.Fprintf(w, "Hello %q!", podName) } otelHandler := otelhttp.NewHandler(http.HandlerFunc(helloHandler), "Hello") http.Handle("/", otelHandler) log.Println("Listening on localhost:8080") log.Fatal(http.ListenAndServe(":8080", nil))}
This YAML deployment manifest file defines that our application, based on ovhplatform/what-is-my-pod-with-tracing:1.0.2 image will be deployed with 3 replicas (3 pods). We pass the pod name on environment variable in order to display it in our what-is-my-pod-with-tracing application.
Then, create a svc.yaml file with the following content to define our service (a service exposes a deployment):
If you need training or technical assistance to implement our solutions, contact your sales representative or click on this link to get a quote and ask our Professional Services experts for assisting you on your specific use case of your project.