
Customise your first app further
Find out how to add a ranked chart to your Getting Started application, display its figures in millions and deploy the change without downtime
Objective
This tutorial picks up the application you built in the Getting Started guide and adds two things to it: a chart that ranks your 7 busiest stations, and a number format that displays ride counts in millions of passengers rather than as long strings of digits.
You build both in the Visual Editor of the Mosaic template, as in Expose and visualise your data, then deploy them as a new version of your application.
Requirements
To follow this tutorial you need the analytics application from Expose and visualise your data, with its version v2 running.
The Visual Editor tab only appears on a running version. Everything below happens on the version that currently serves your users, and you copy it at the end to publish your changes.
What you will build
Instructions
Step 1: Opening the Visual Editor
Open Applications & APIs, then your analytics application, then its version v2, and go to the Visual Editor tab.
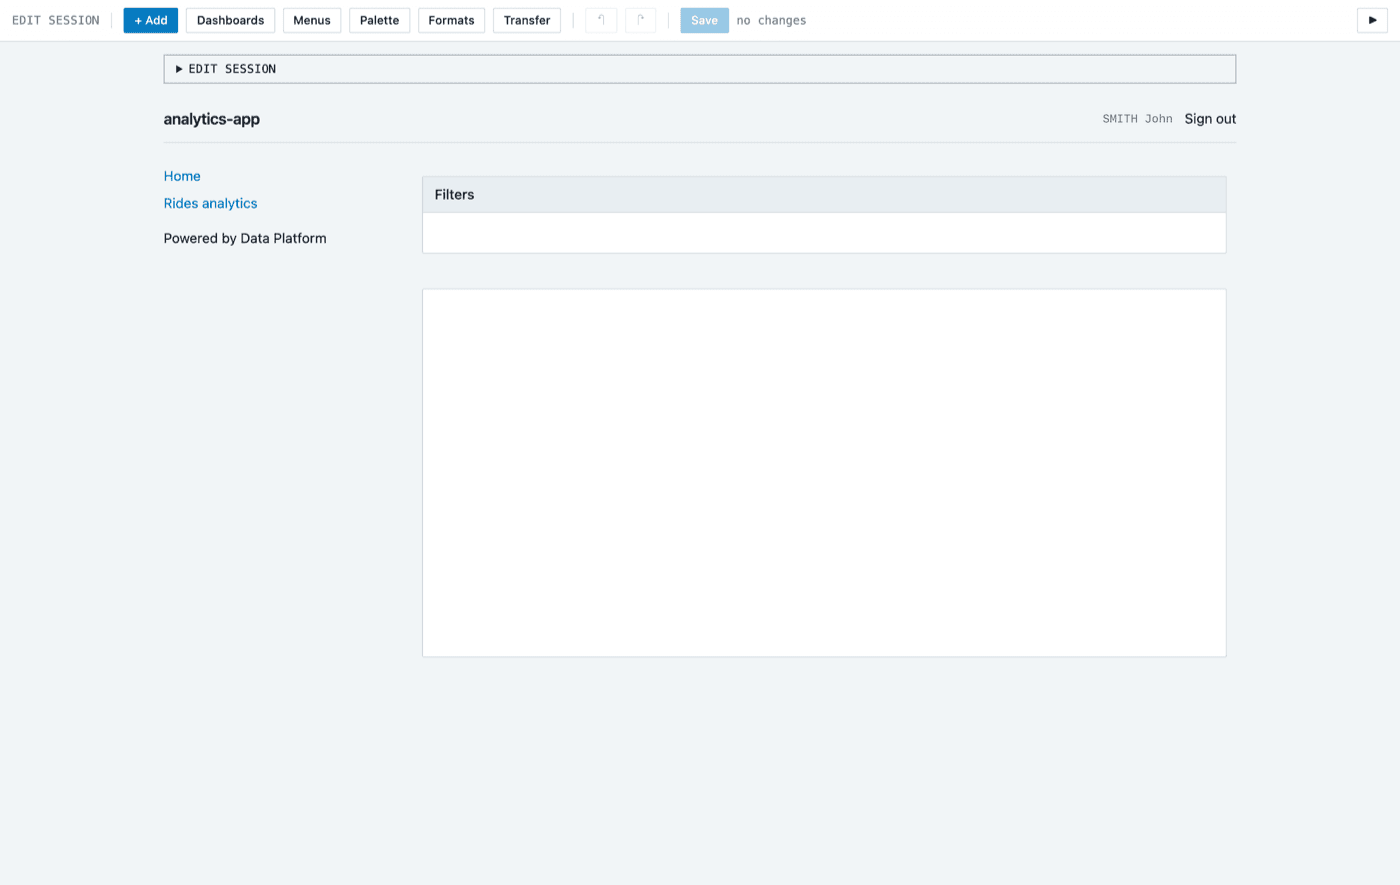
The editor opens on Home, the page that the Mosaic template creates in every application. It holds two containers: Filters at the top, and an empty container below it. This tutorial fills the empty one. The Rides analytics page you built in the Getting Started guide stays as it is.
Step 2: Declaring a number format
Your ride counts run into the millions, and a chart that prints 25833640 is hard to read. A number format fixes that once for the whole application.
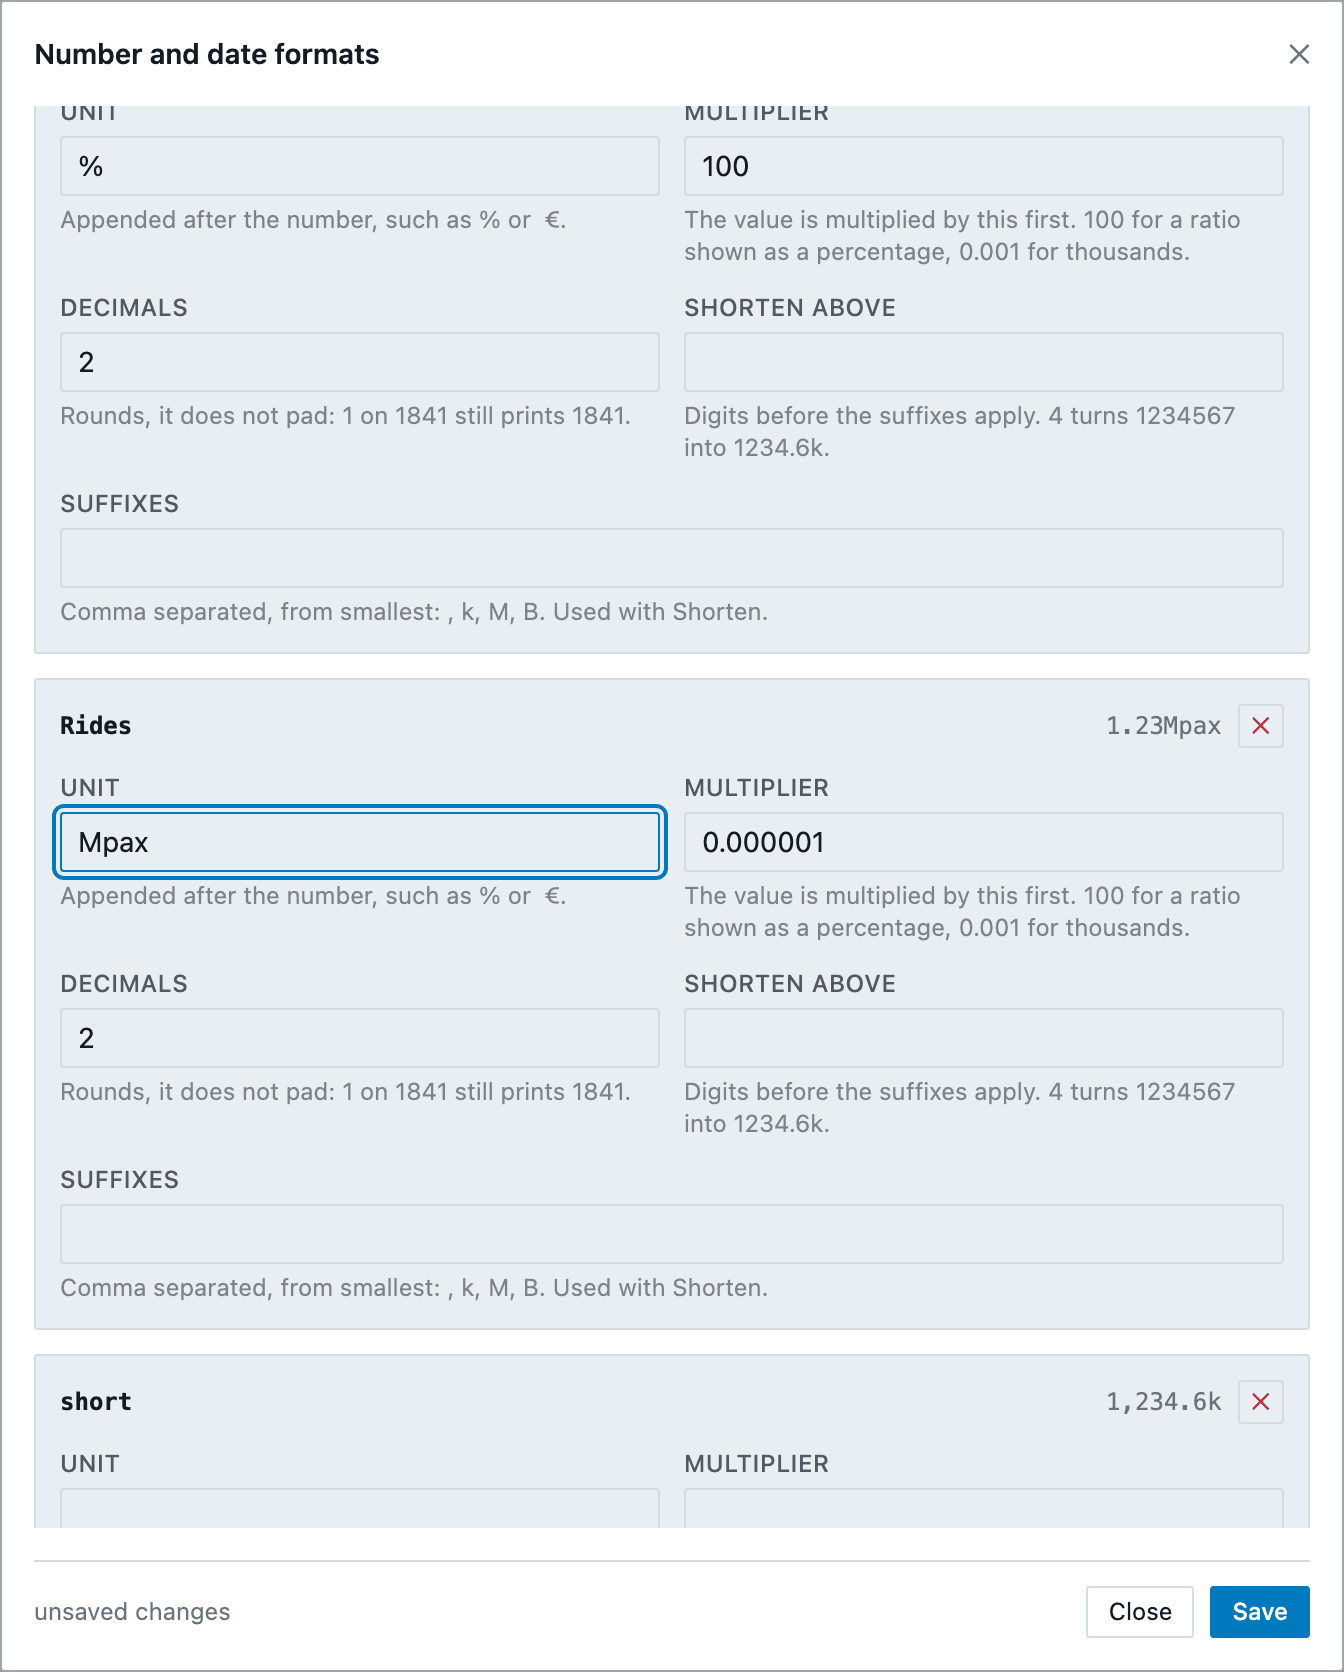
Click Formats in the toolbar. The Number and date formats dialog lists the formats the application already has, such as percentages and shortened numbers.
Under Measures, enter Rides in the name field and click Add. Then fill in the new entry:
Leave Shorten above and Suffixes empty. Next to the name of the entry, a preview shows a sample value in this format, 1.23Mpax: check it before you save.
Click Save, then Close.
The formats are saved in the sources of the version, in config/formatter.json, and are shared by every chart of the application. They travel with the version when you copy it in Step 5.
Step 3: Adding a heading
Point at the empty container below Filters and click its + Add button, then select Basic > HTML.
The HTML options panel opens on the right. In HTML, enter:
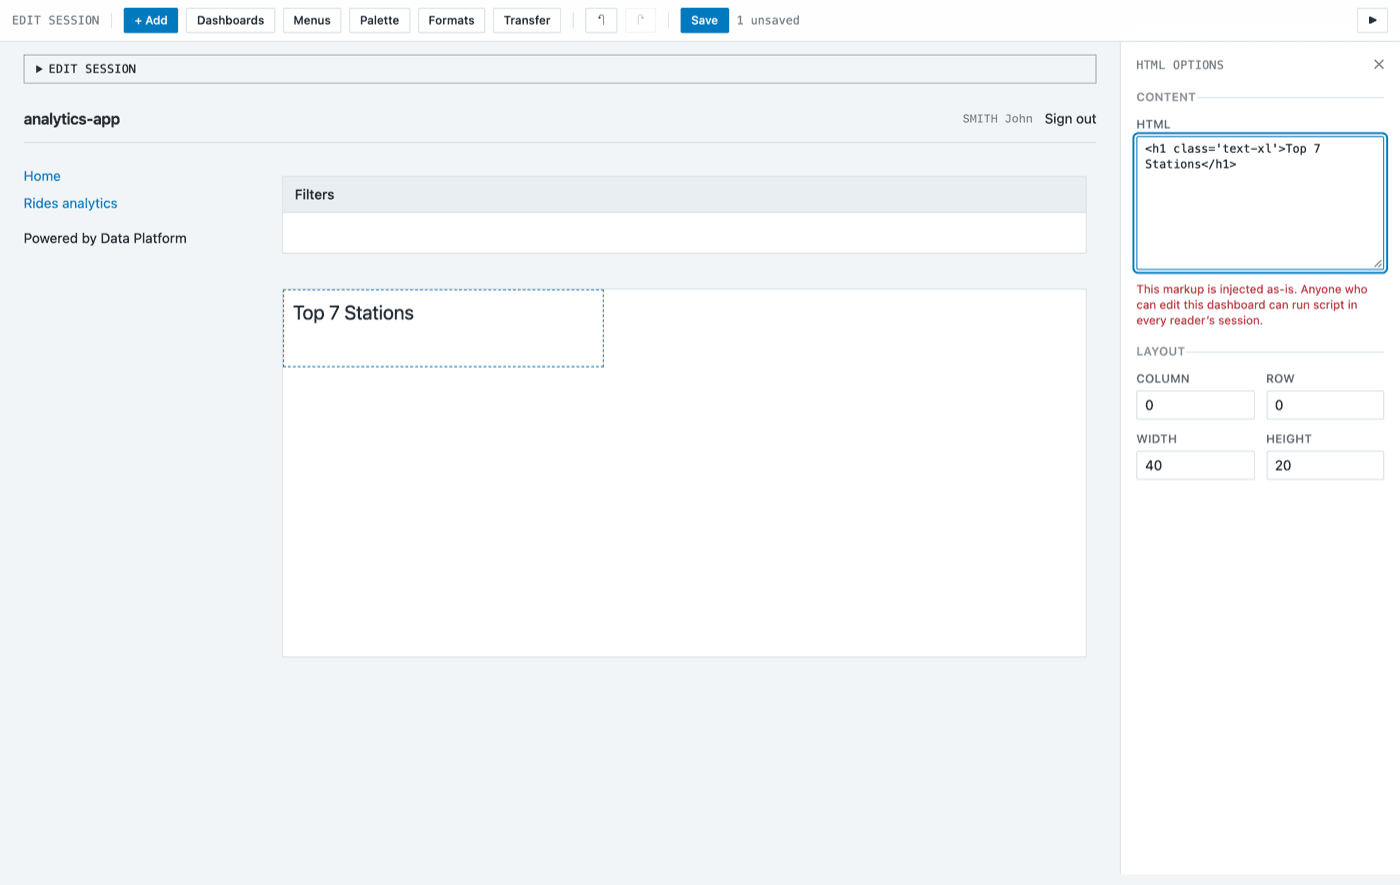
The content of an HTML block is injected as it is. Anyone who can edit the dashboard can run a script in the session of every reader, so only give edit access to people you trust.
The + Add button of the container only shows while your pointer is over the container.
Step 4: Adding the ranked chart
Click + Add in the same container again and select Charts > Bar horizontal.
In the General tab, name the chart Top 7 stations.
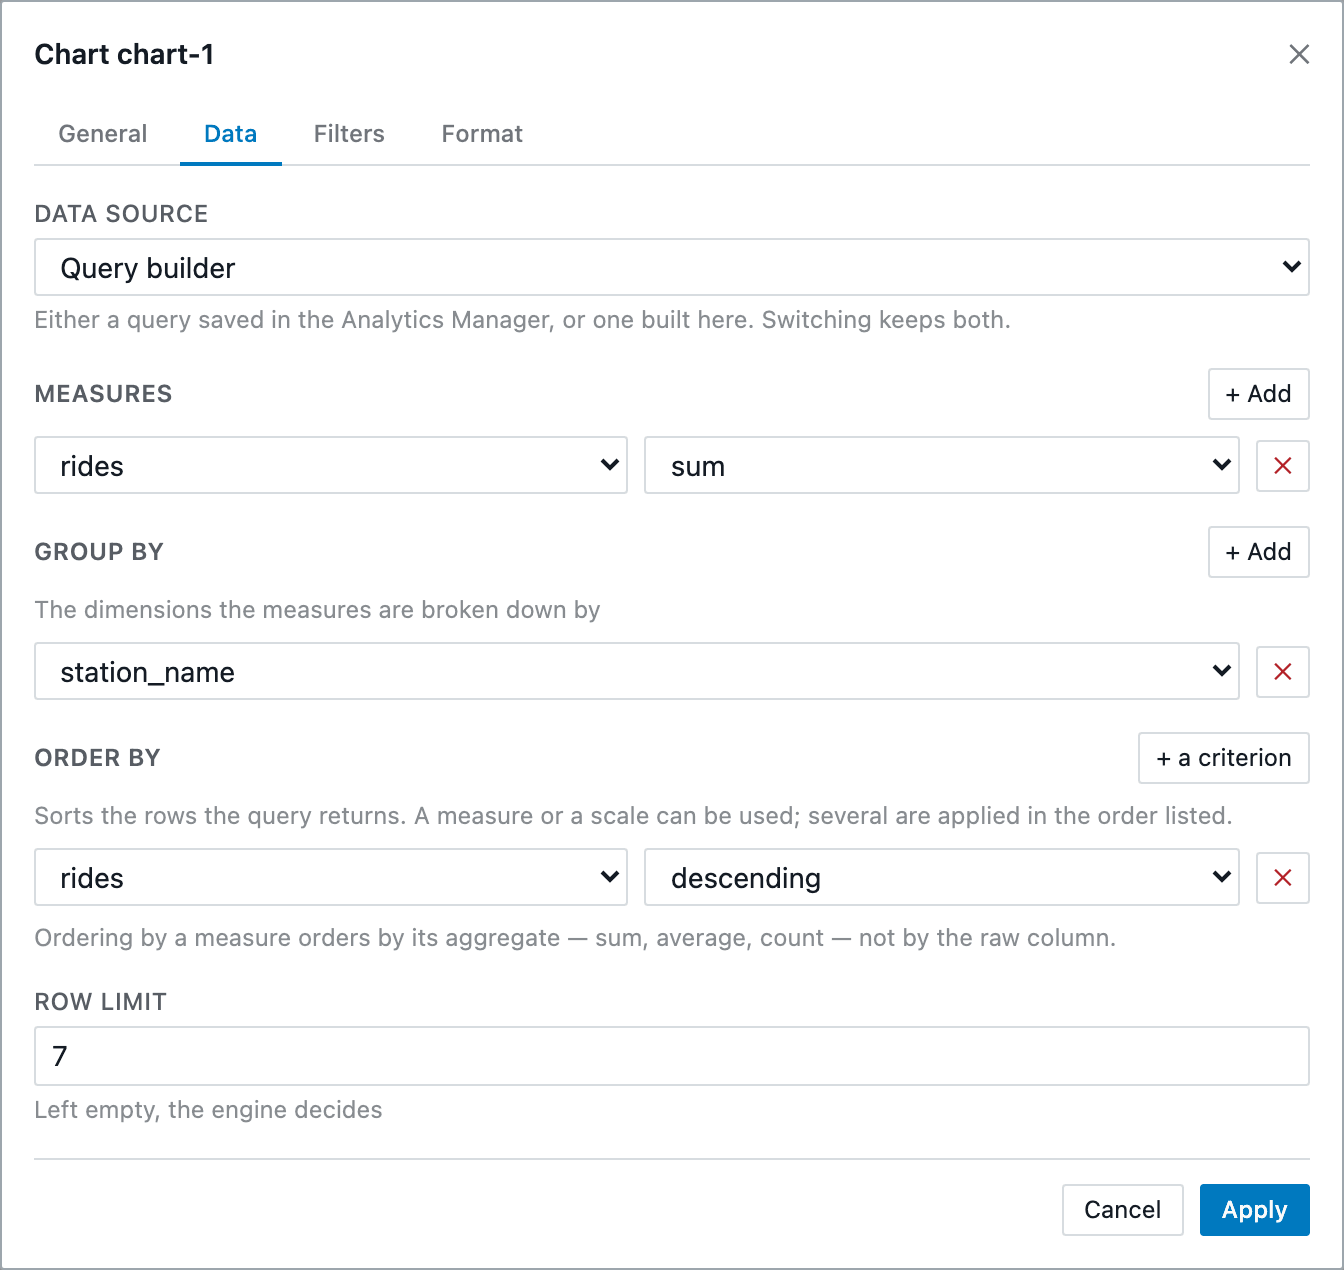
Open the Data tab. Leave Data source on Query builder, then describe the ranking:
- Under Measures, click + Add and select
rideswith thesumaggregation. - Under Group by, click + Add and select
station_name. - Under Order by, click + a criterion and select
rides,descending. - In Row limit, enter
7, to keep only the 7 busiest stations.
Open the Format tab. It lists the fields of the chart. On the rides row, select the Rides format you declared in Step 2: the preview reads 1.23Mpax. The axis and the tooltips of the chart now use it.
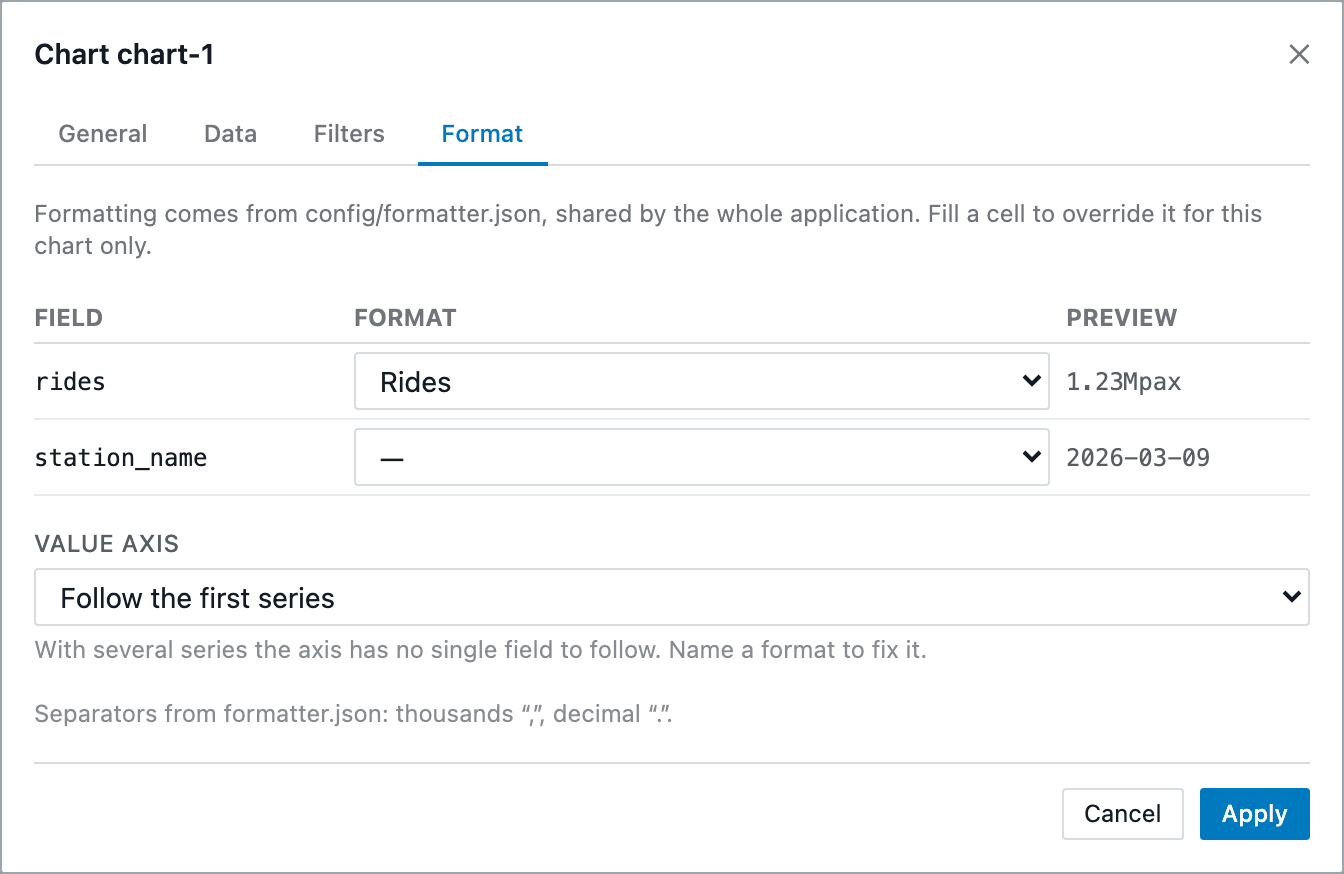
Click Apply. The chart queries your data through your API and draws the 7 busiest stations, with an axis in Mpax.
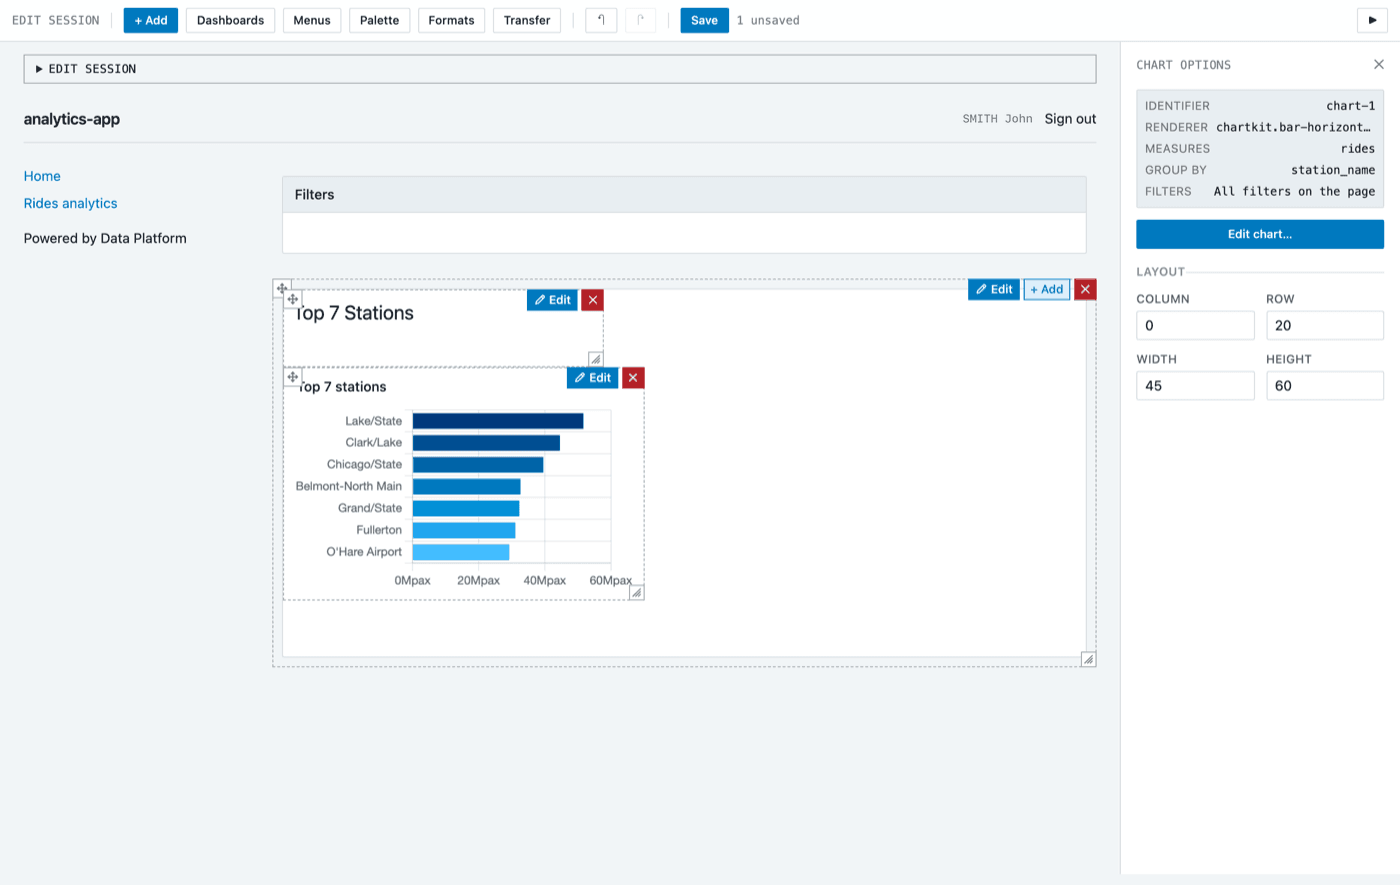
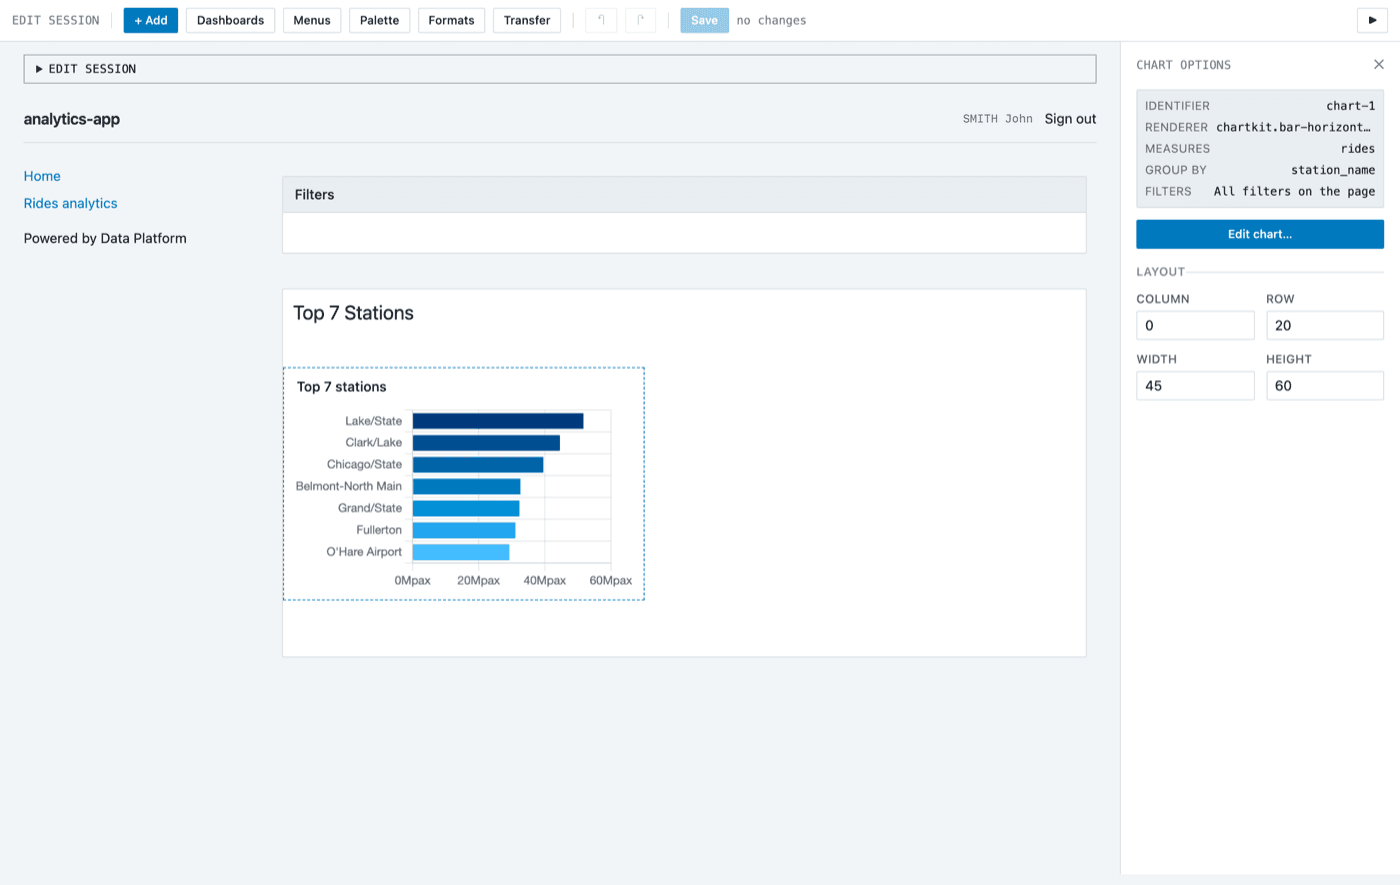
Click Save in the toolbar. The counter next to it goes back to no changes.
Step 5: Deploying a new version
Saving writes your changes into the sources of v2, but your users are still served the build made before them. To publish them, copy the running version:
-
Go back to the overview of your application.
-
On the Deployed version card, open the … menu and select Copy.
-
Name the copy
v3, tick Auto Build and Auto Deploy, and click CREATE.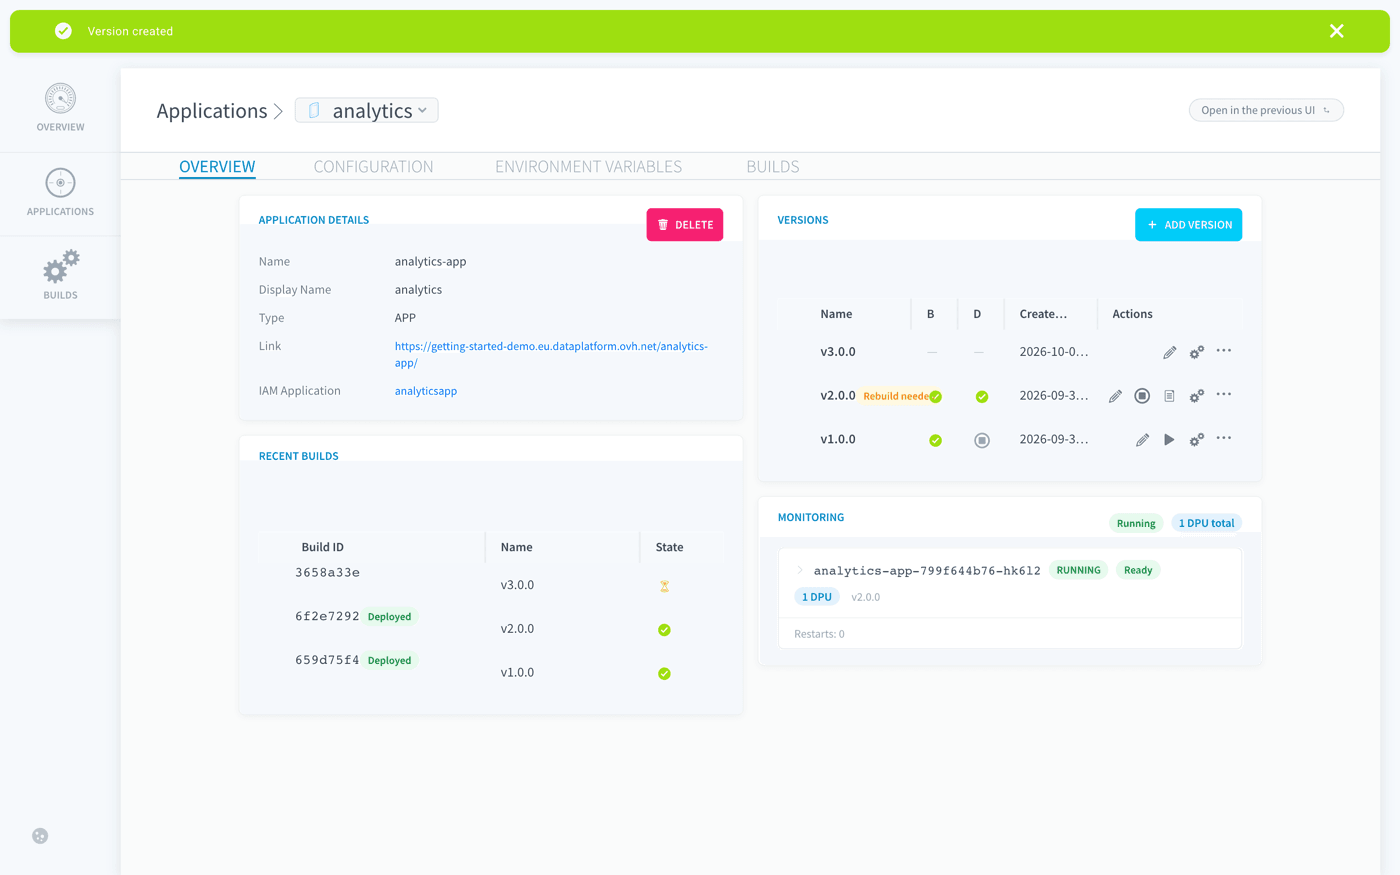
v2 keeps serving your users while v3 builds and deploys. Data Platform switches to v3 once it is ready, then stops v2.
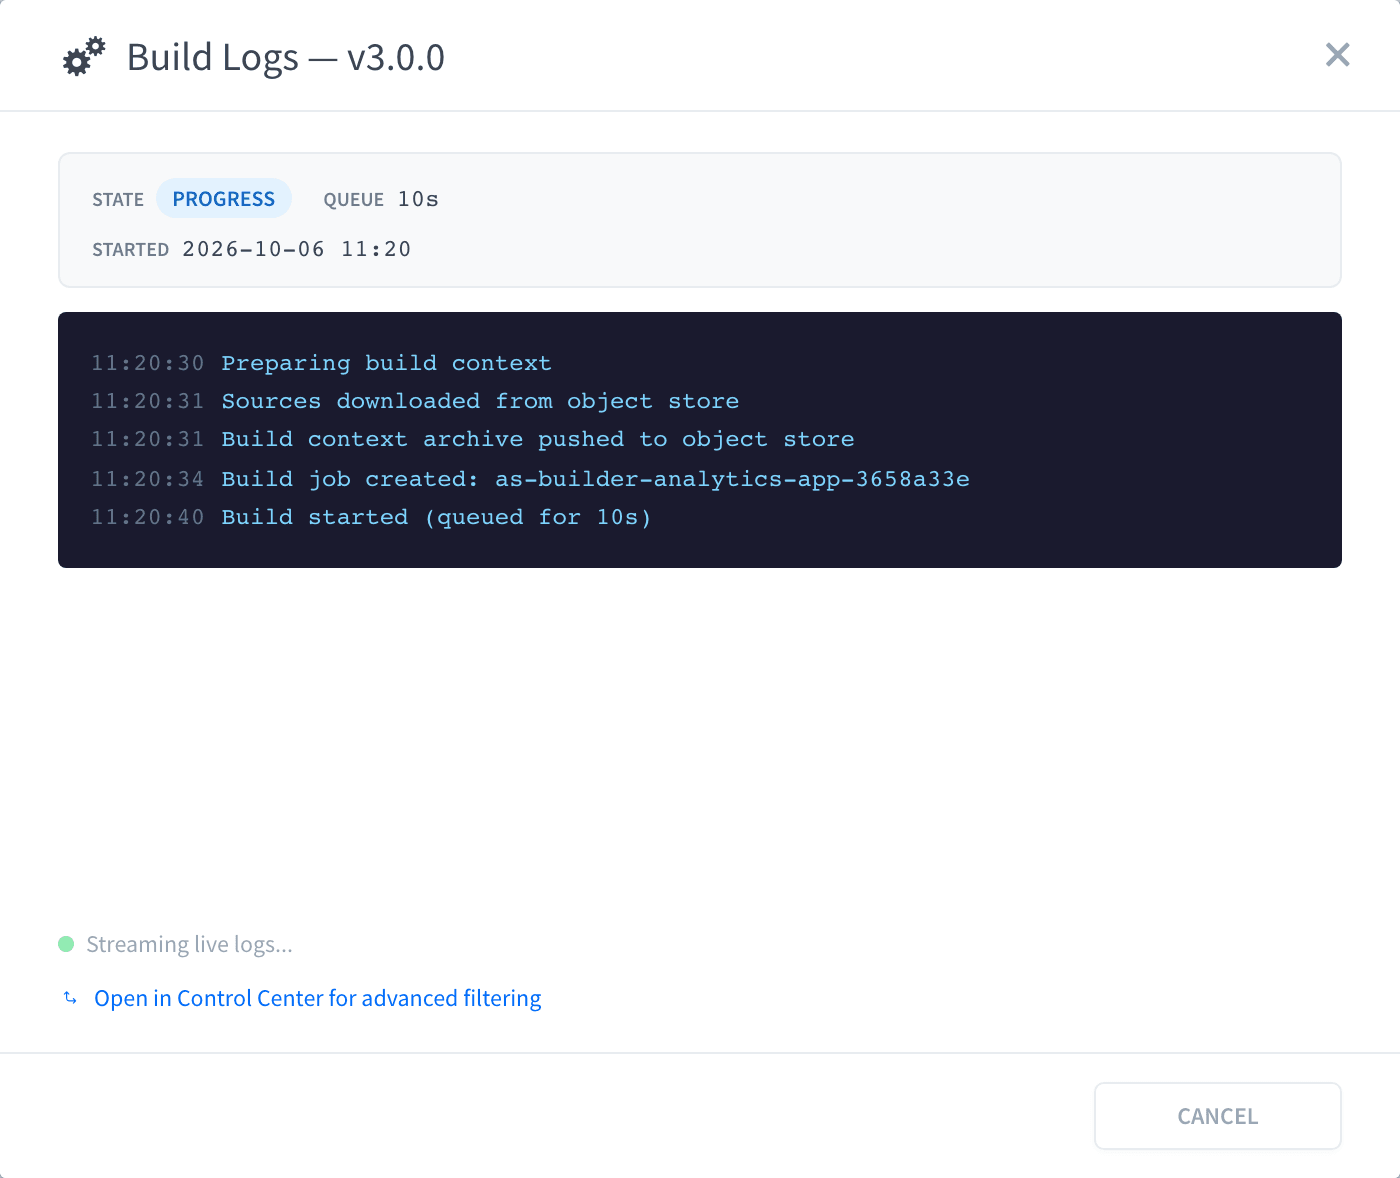
The build takes a couple of minutes. To follow it, open the Builds tab of the version and click the logs icon. The Build Logs dialog shows the state of the build, its time in the queue and each step as it runs.
Step 6: Opening your application
Once v3 is running, open your application and sign in with Data Platform. Home now shows the Top 7 Stations heading and the ranked chart, with its figures in millions of passengers.
What you have built
Your application has a number format shared by all its charts, and a ranked chart on its Home page, deployed as version v3 without interrupting your users. You can reuse the same format in every chart that displays rides.
Looking for more flexibility?
The Visual Editor is the quickest way to build an application. If you are a developer looking for full control over your application code, Data Platform also provides templates built with modern front-end frameworks.
These templates connect to the same API and let you build fully custom applications with your own development workflow.
Build a custom app with React, Vite & Shadcn
Go further
For training or technical assistance implementing our solutions, contact your sales representative or visit our Professional Services page to request a quote and have your project analysed by our experts.
Ask questions, give your feedback and interact directly with the team building the Data Platform on the dedicated Discord channel.
If you need support with your OVHcloud services, create a request in our Help Centre.
Join our community of users.