
Build a Vélib' availability dashboard in Superset
Find out how to build a Superset dashboard on the Vélib' history: bikes available now, daily rhythm, problem stations and daily trends
Objective
This guide walks you through building a Superset dashboard on top of the Vélib' history: where to find a bike right now, how the network breathes during the day, which stations are often empty or full, and how each day compares to the others.
It is the second part of Collect Vélib' availability every hour with SQL only. Superset queries the Lakehouse through Trino, so all SQL on this page is in the Trino dialect.
Requirements
To follow this guide you need:
- the table
velib_rawand the five views created in Collect Vélib' availability every hour with SQL only. - an Apache Superset application connected to your project. If you have not deployed it yet, follow the Deploying Apache Superset on OVHcloud Data Platform guide.
- one Superset dataset for each of the views
station_current,network_hourly,station_profileandvelib_daily, created in Step 8 of the collection guide. - ideally, a week of collection: the charts of the Daily rhythm and Trends tabs fill in as days go by.
What you will build
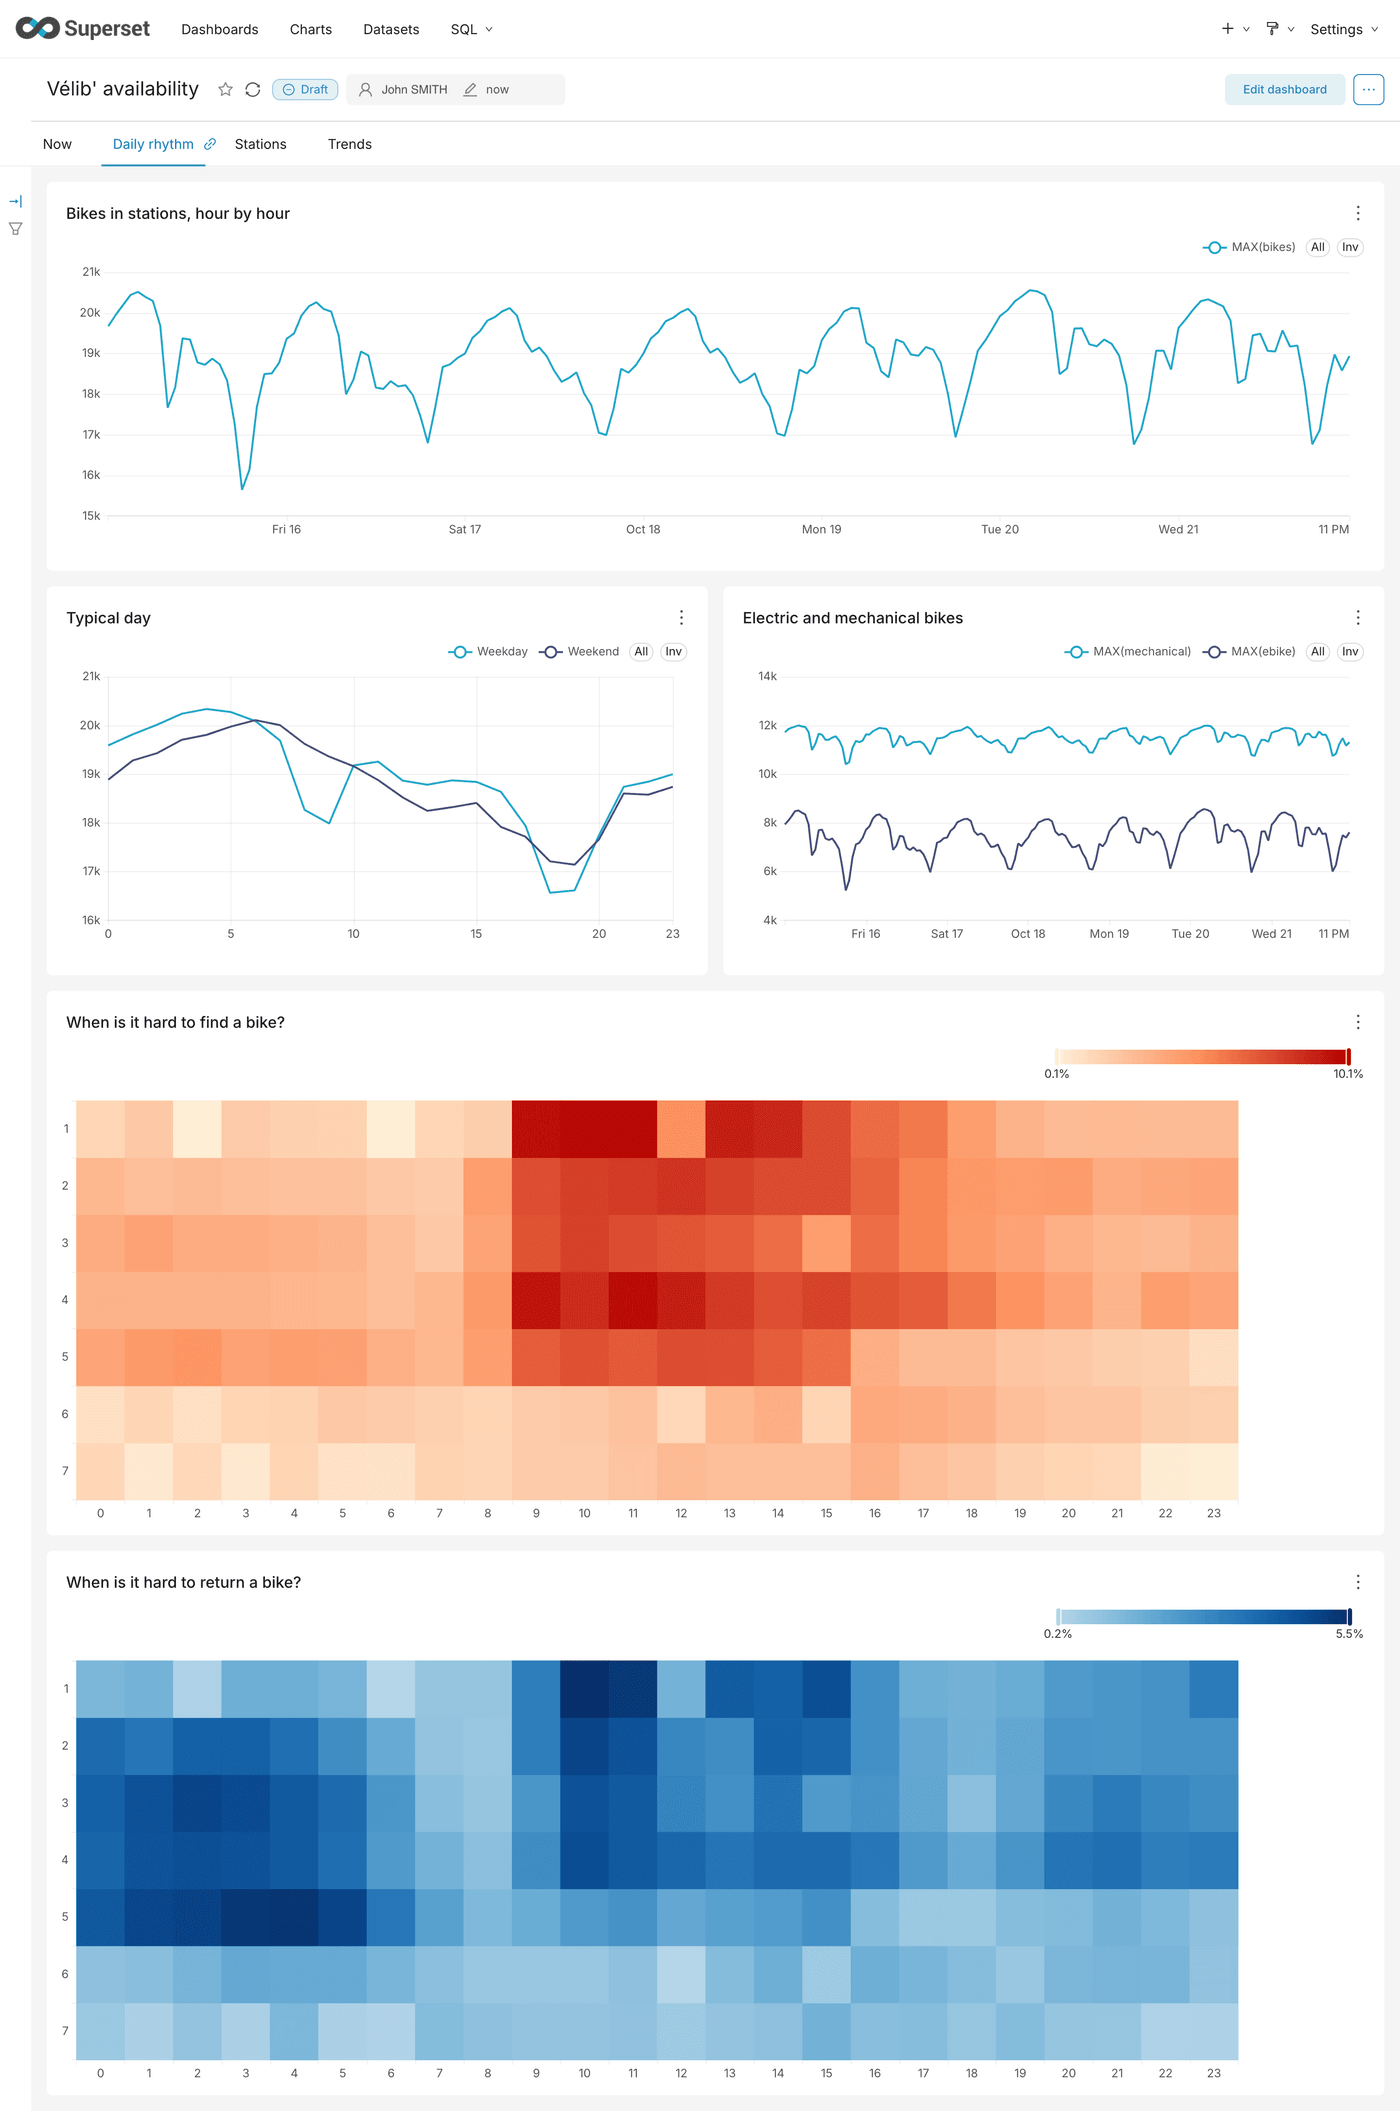
At the end of this part, your dashboard looks like this:
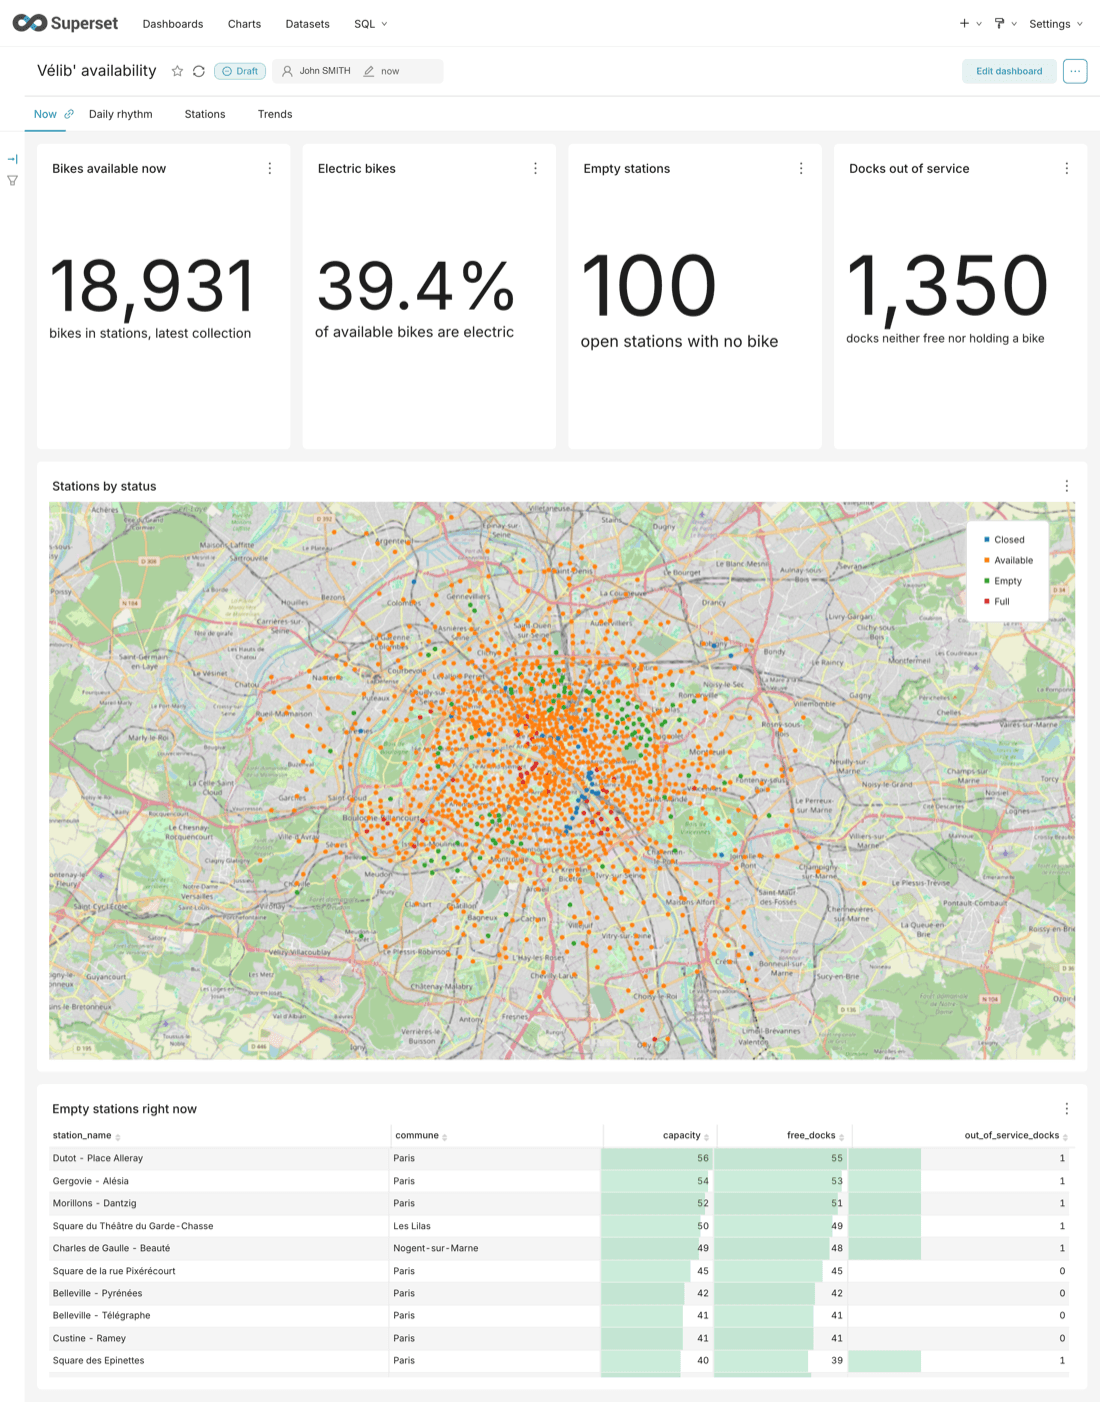
Map data © OpenStreetMap contributors. Vélib' data © Smovengo / Syndicat Autolib' Vélib' Métropole, published by Ville de Paris under the Open Database License (ODbL).
Every chart follows the same path in Superset: Charts > + Chart, pick the dataset and the chart type, fill in the settings, click Create chart, then Save with the chart name and the dashboard Vélib' availability. The first chart you save creates the dashboard; you lay out the charts in its tabs in Step 5.
Note: your charts will look like the screenshots, but not with the same values: the figures depend on when you collect and for how long. The Now tab is complete from the first collection. The Daily rhythm, Stations and Trends tabs only take a similar shape a few days later: until then, the lines are short, the heatmaps have empty cells and the rankings still move.
Instructions
Step 1: Building the Now tab
These charts use the dataset station_current: one row per station, at the latest collection.
Key figures
The four tiles use the chart type Big Number.
Expected values, at the time of writing: about 19,000 bikes, about 40% electric bikes, about 100 empty stations and more than 1,000 docks out of service. The figures change with each collection.
1e0 avoids an integer division, which would return 0. A closed station is not counted as empty, and in a closed station every dock looks unavailable: the last two tiles only count open stations.
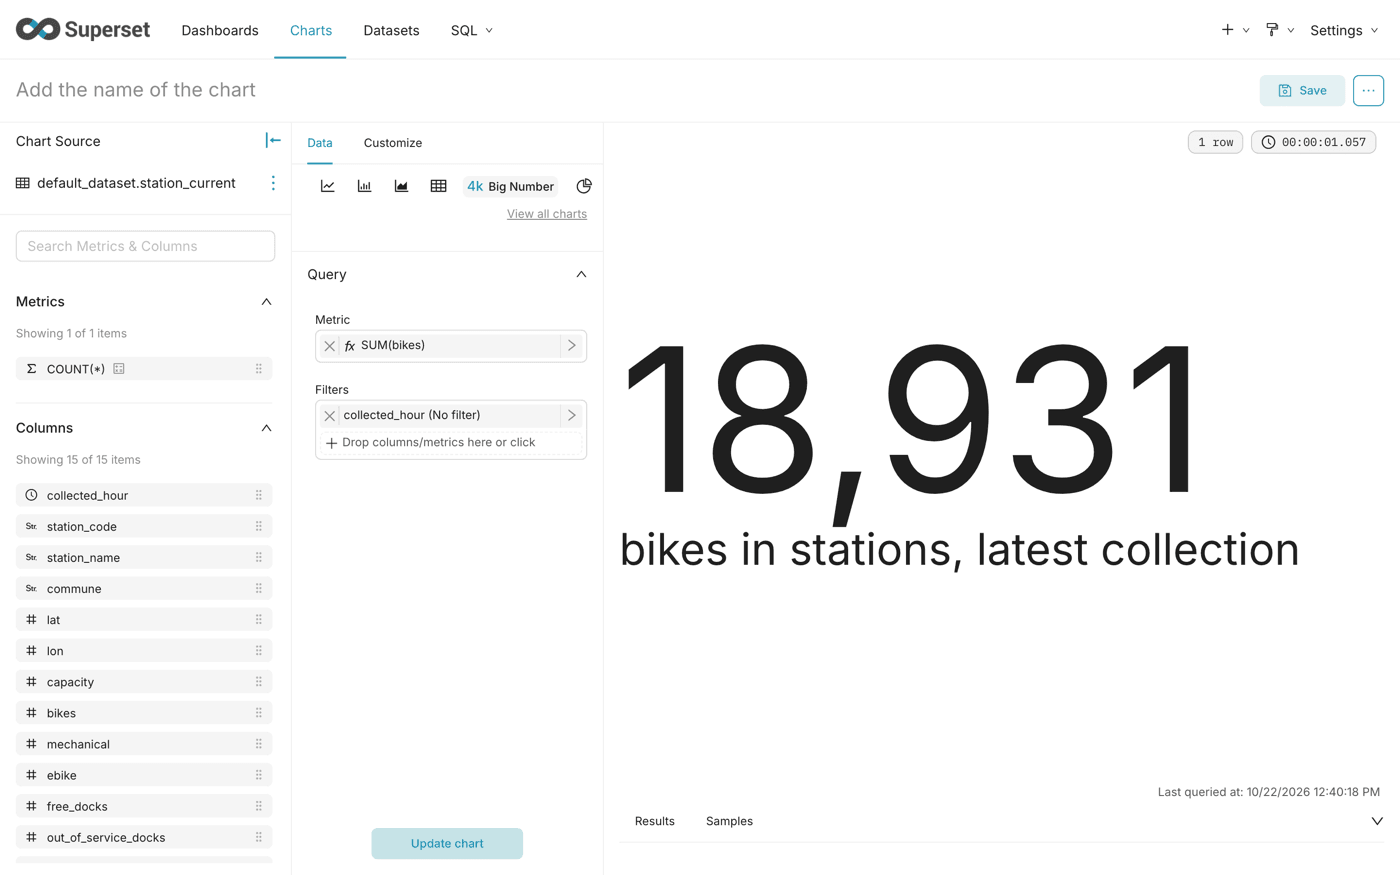
Stations by status
The map shows every station, coloured by its state at the latest collection.
Use deck.gl Scatterplot: it is the only map type that draws one point per station with a colour per category. MapBox needs a Mapbox key, which means a third-party account. The grid and hexagon maps group the stations into cells, and lose the station.
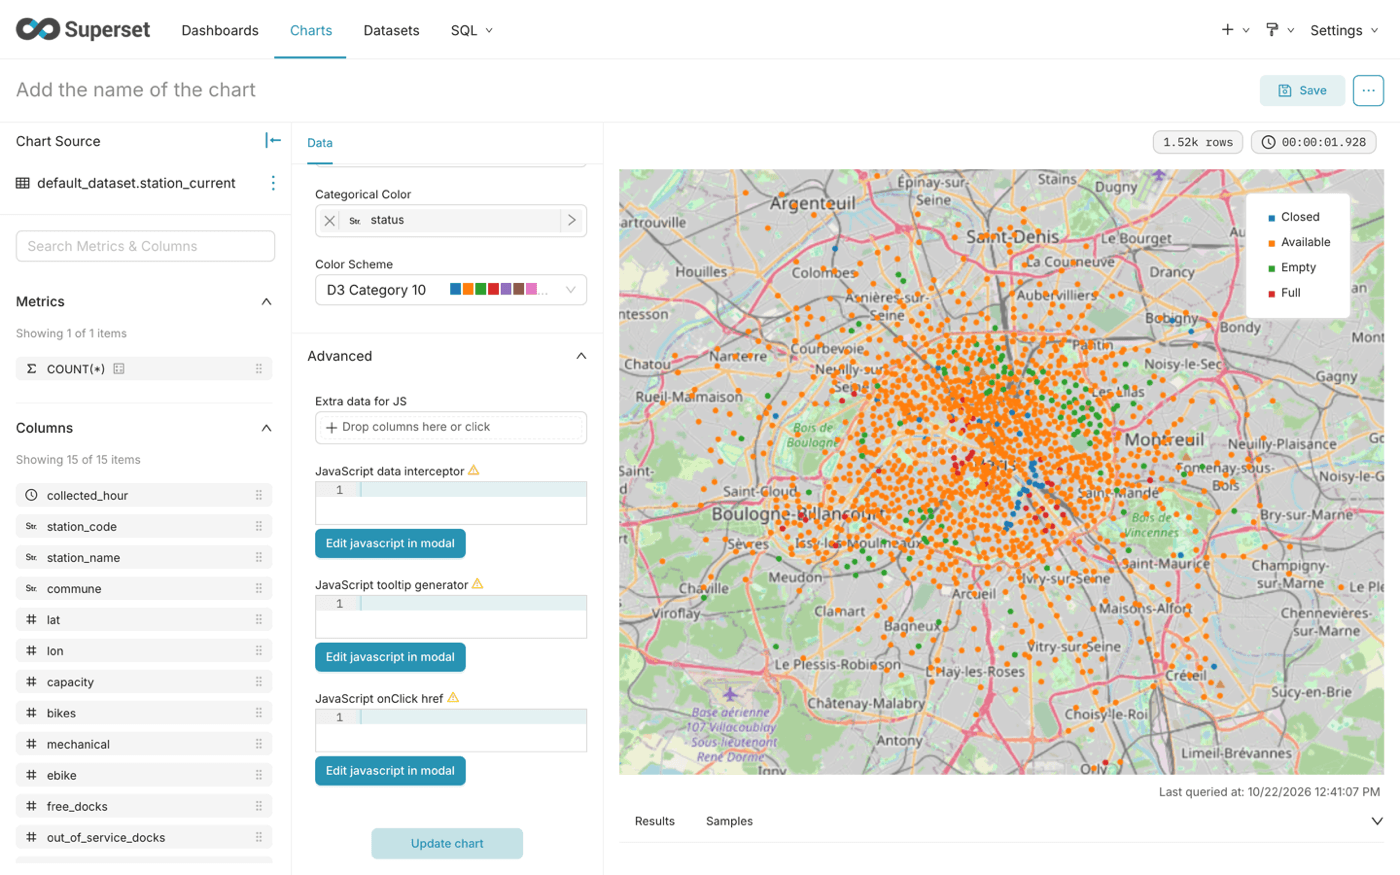
Map data © OpenStreetMap contributors.
Empty stations right now
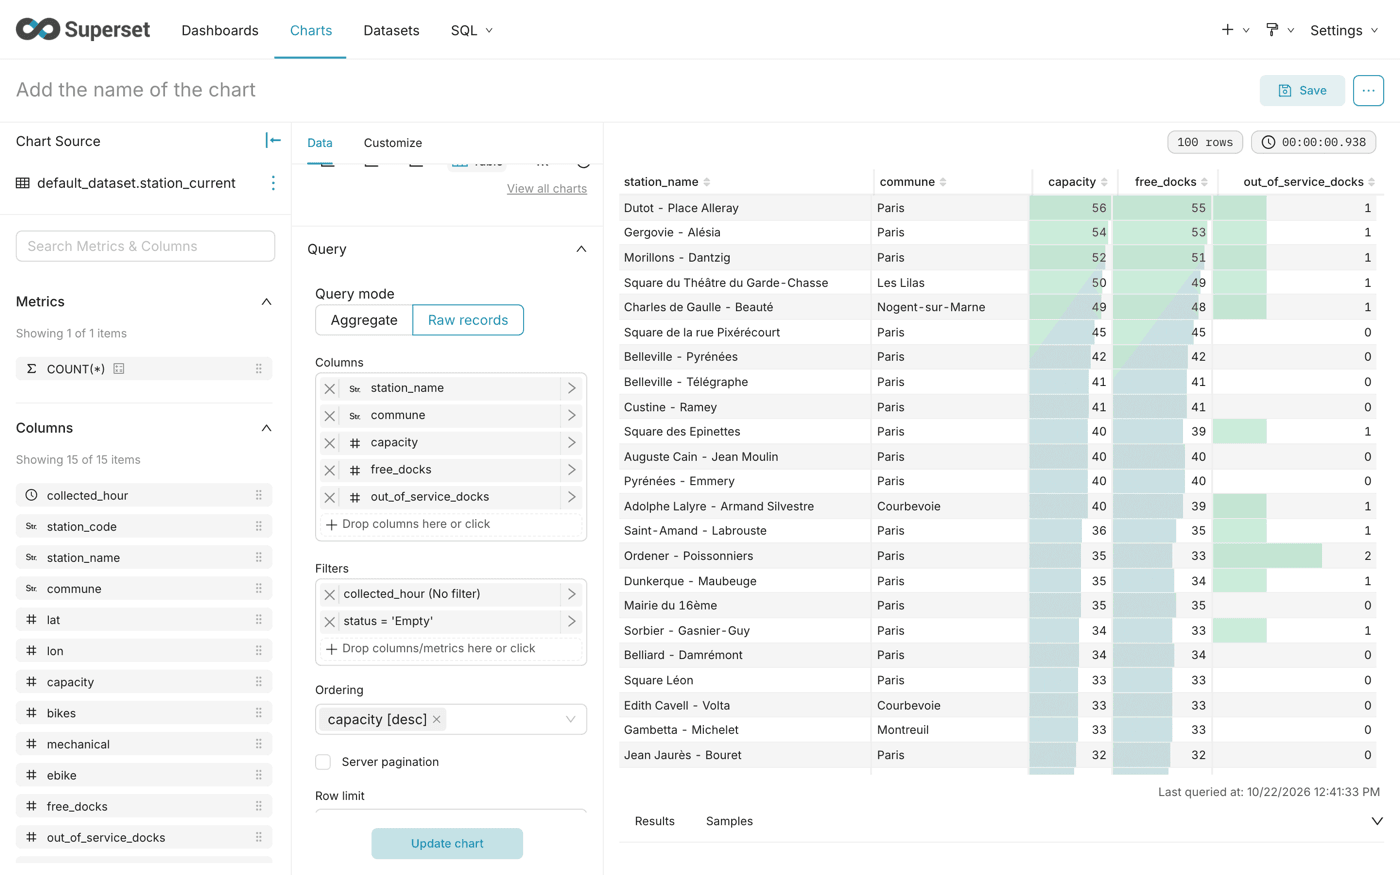
The table gives the details that the map cannot show in a tooltip.
Raw records shows one row per station, without grouping. Sorting by capacity brings the largest empty stations first: they leave the most users without a bike.
The table holds as many rows as the Empty stations tile shows. For each station, free_docks plus out_of_service_docks equals capacity: an empty station has no bike, so every dock is either free or out of service.
Step 2: Building the Daily rhythm tab
These charts use the dataset network_hourly: one row per hour for the whole network. They fill in as the collection goes on.
Bikes in stations, hour by hour
The network breathes: available bikes drop when they are on the road, and come back at night.
network_hourly already holds one row per hour, so the aggregate groups nothing: MAX returns the value of the hour. The only exception is the night the clocks go back, when two UTC hours share the same Paris hour: MAX then keeps the higher of the two instead of adding them up. The filter keeps the last seven days, 168 points, so the chart stays readable as the collection grows.
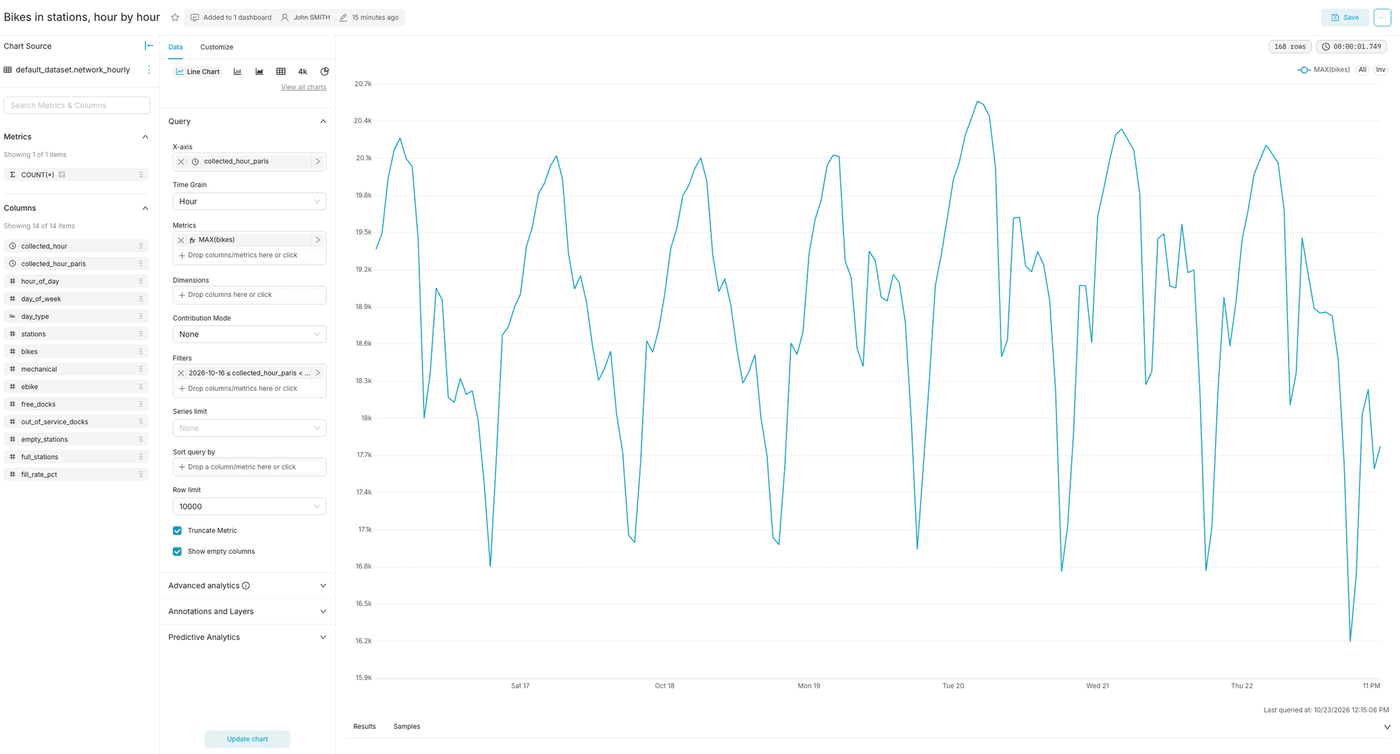
This chart shows what really happened, day after day. The next one averages all days into a typical day.
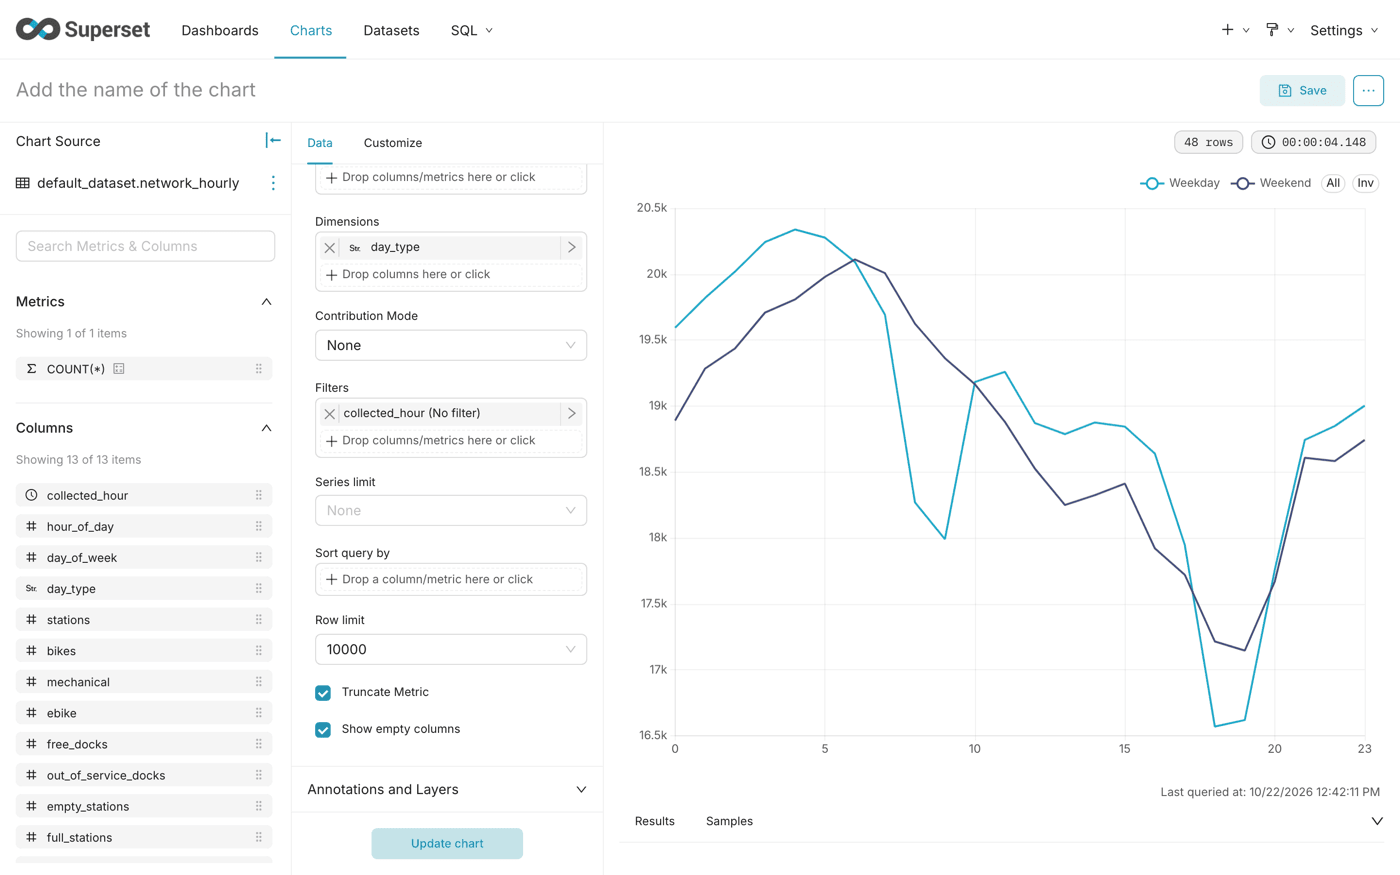
Typical day
The average day, hour by hour, with one line for weekdays and one for weekends.
The X-axis is the hour of the day, from 0 to 23: every 8 a.m. is grouped together, whatever the day, and the average gives the typical number of bikes available at 8 a.m. The Weekend line appears on its own once the collection covers a Saturday.
On weekdays, the line drops at the morning rush hour, around 9 a.m., and even lower at the evening one, around 6 p.m.
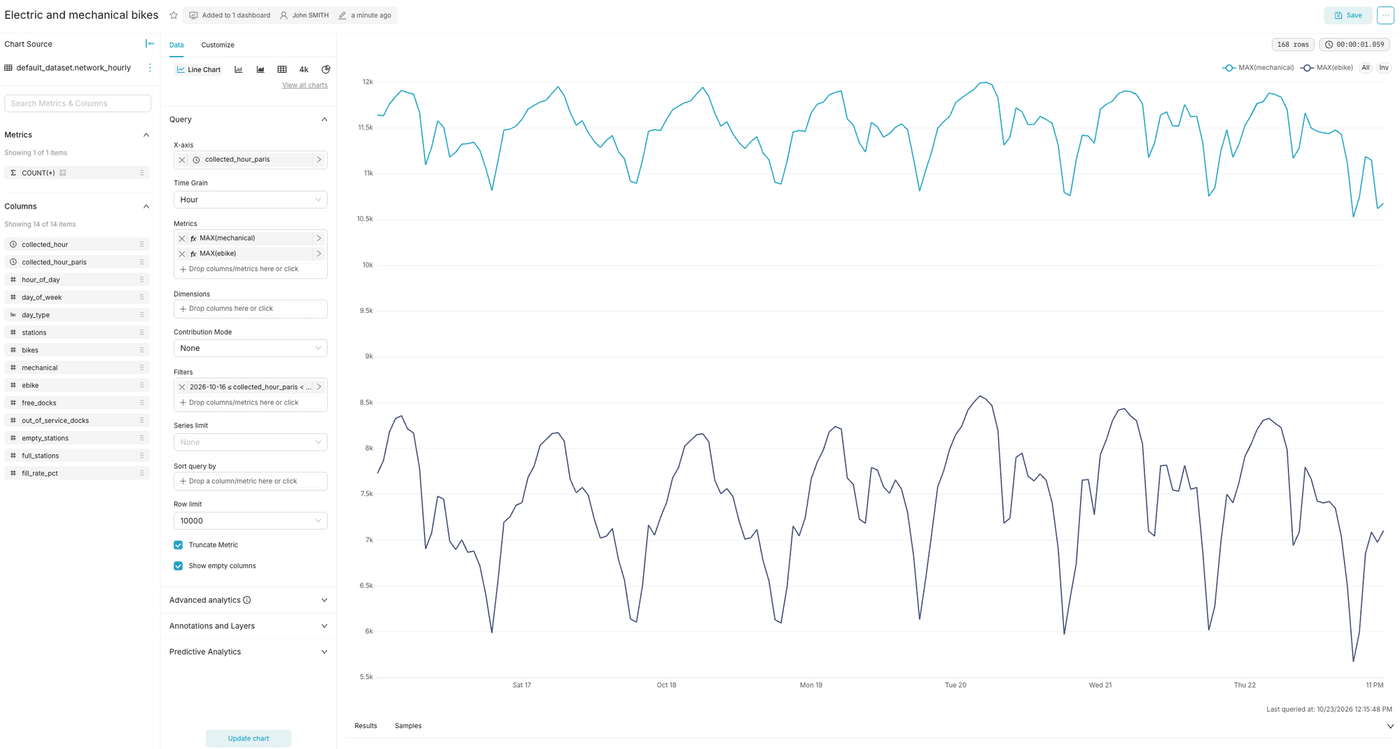
Electric and mechanical bikes
Two lines, one per type of bike, to compare how each one varies.
The electric bikes line swings much more than the mechanical one, between night and rush hours.
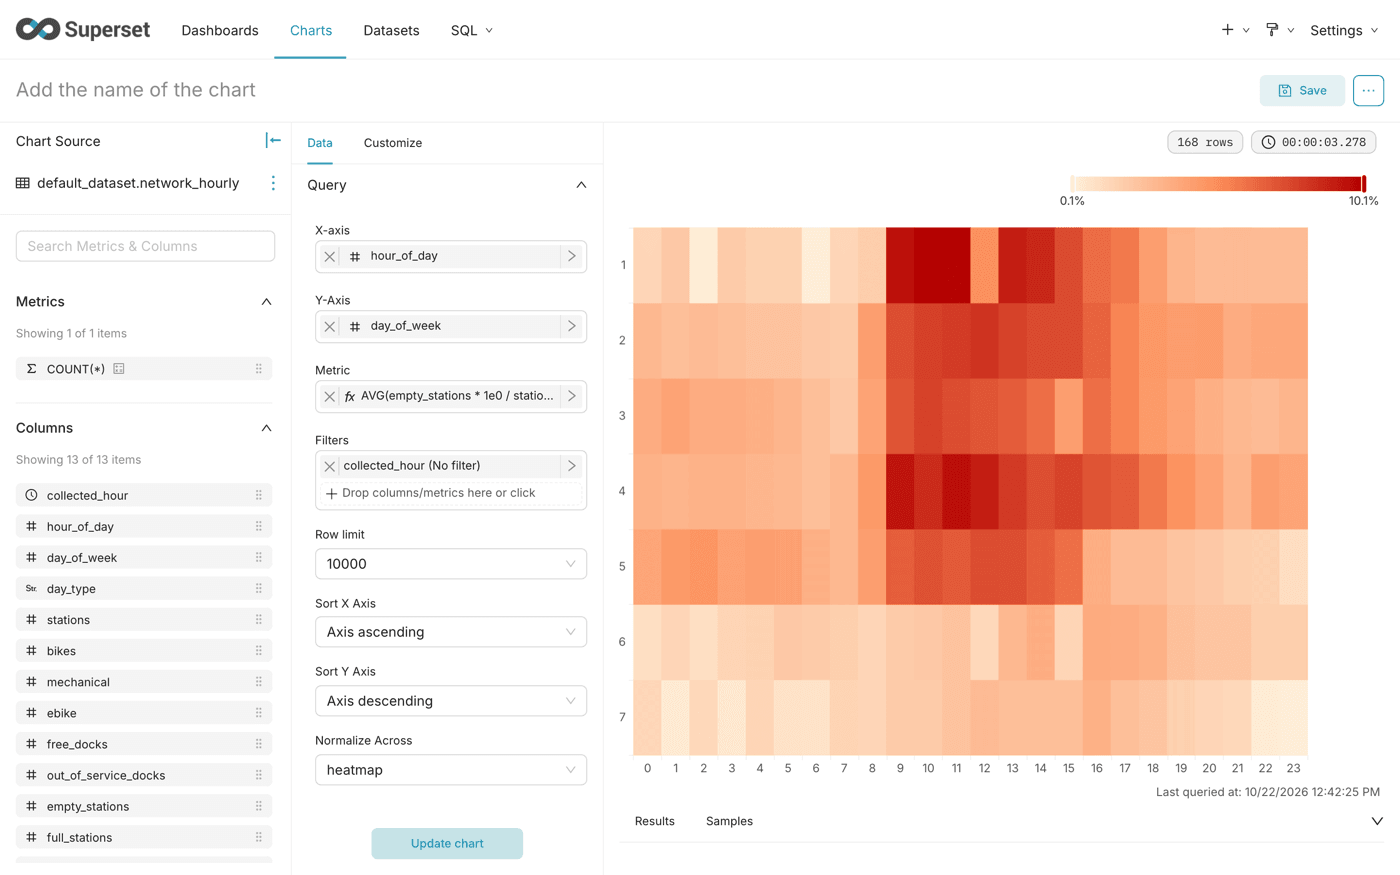
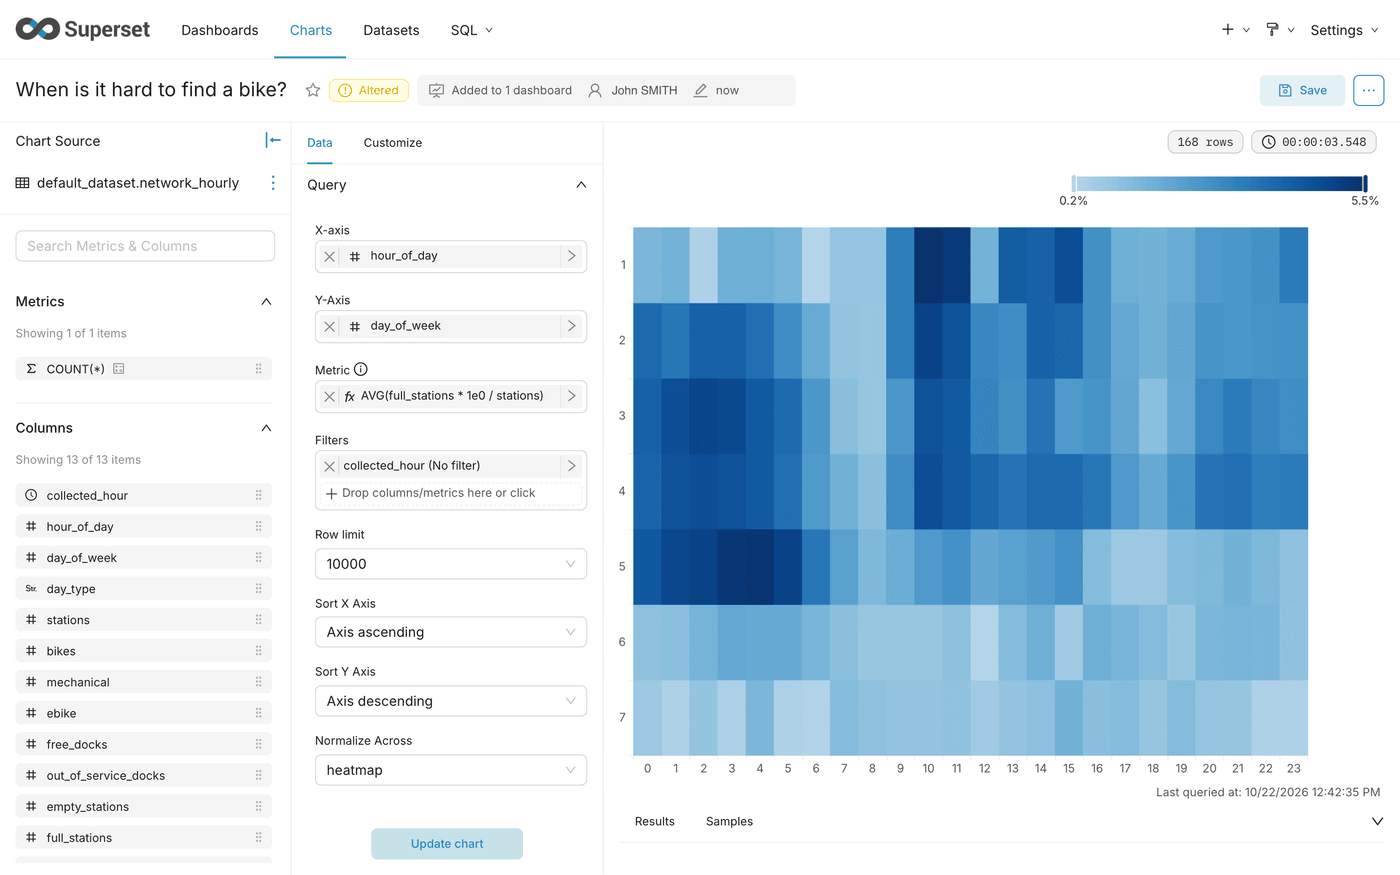
When is it hard to find a bike?
A heatmap of the day of the week against the hour, coloured by the share of empty stations. The darkest cells are the time slots when finding a bike is the hardest.
The metric divides empty stations by open stations, so the share stays comparable when a few stations close or reopen. 1e0 avoids an integer division.
Sort both axes by their value: the default order follows the query results, and Metric ascending would sort the hours by their share of empty stations. Axis ascending puts the hours from 0 to 23, and Axis descending on the Y-axis puts Monday at the top, like a calendar.
On weekdays, the darkest cells come late in the morning, between 9 and 11 a.m., with up to about 10% of empty stations. Nights and weekends are the lightest.
This does not contradict the typical day, where the fewest bikes are parked around 6 p.m. The evening has fewer bikes in stations, but in the morning they are spread less evenly: the next heatmap shows that full stations also peak late in the morning. Some stations run empty while others fill up, and the number of empty stations measures that imbalance, not the number of bikes.
When is it hard to return a bike?
The mirror heatmap: the share of open stations with no free dock, where users cannot return their bike.
The quickest way is to start from the previous chart: change the metric, click Save, select Save as... and enter the new name.
Keep the same sorts as the first heatmap, so that both read cell by cell. Each heatmap has its own colour scale, from its own minimum to its own maximum: compare the values, not only the colours.
Full stations do not peak at the same hours as empty ones: the darkest cells come at night on weekdays, and again late in the morning, with up to about 5.5% of full stations.
Step 3: Building the Stations tab
These charts use the dataset station_profile: one row per station, over the whole collection. All three use the chart type Bar Chart, with the Horizontal orientation: it leaves room for the names.
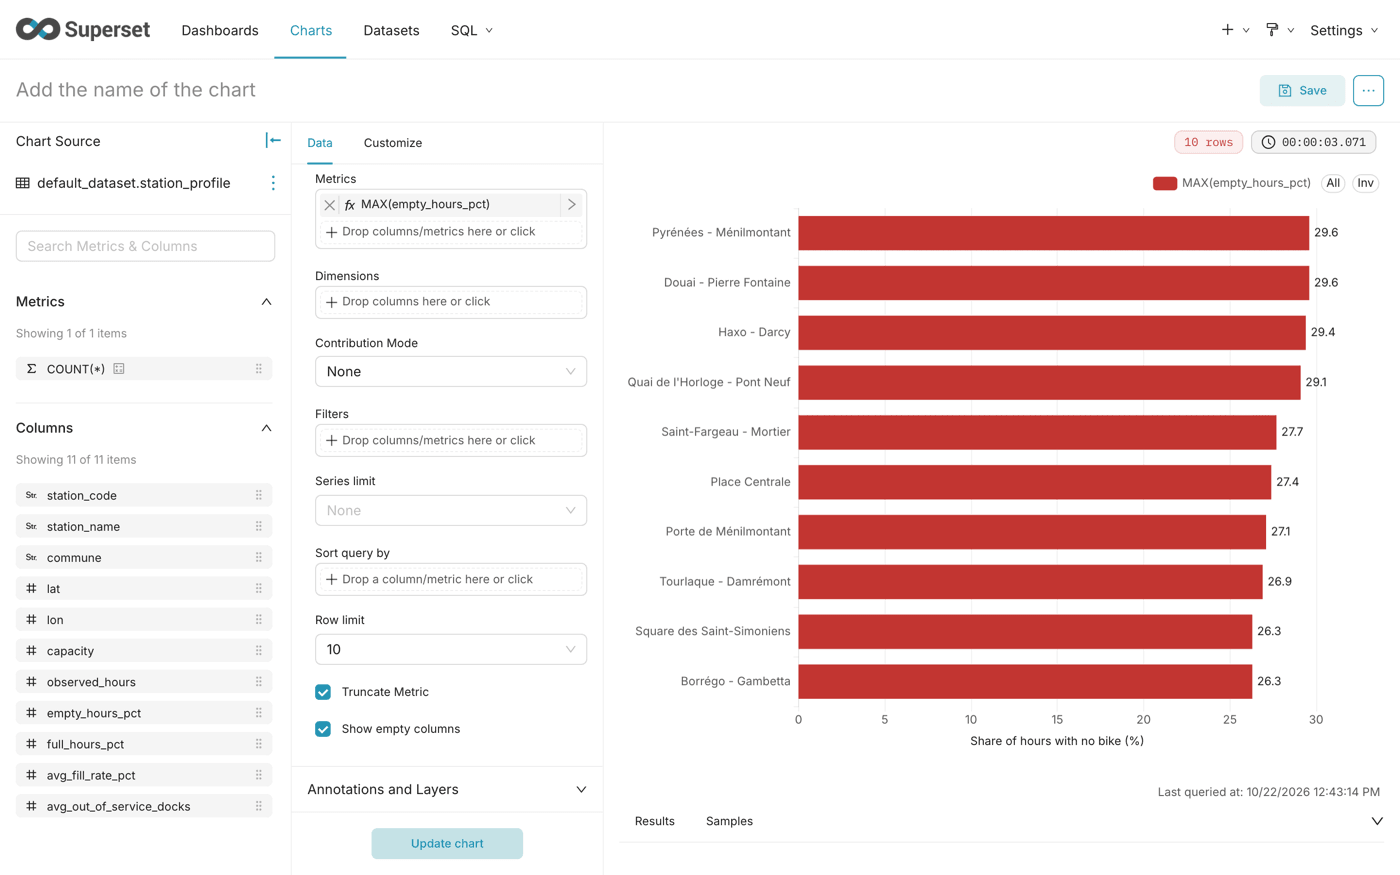
Most often empty
The ten stations that spend the most time without any bike.
station_profile already holds one row per station, so MAX returns the share of the station.
The chart ranks the ten stations by their share of hours with no bike.
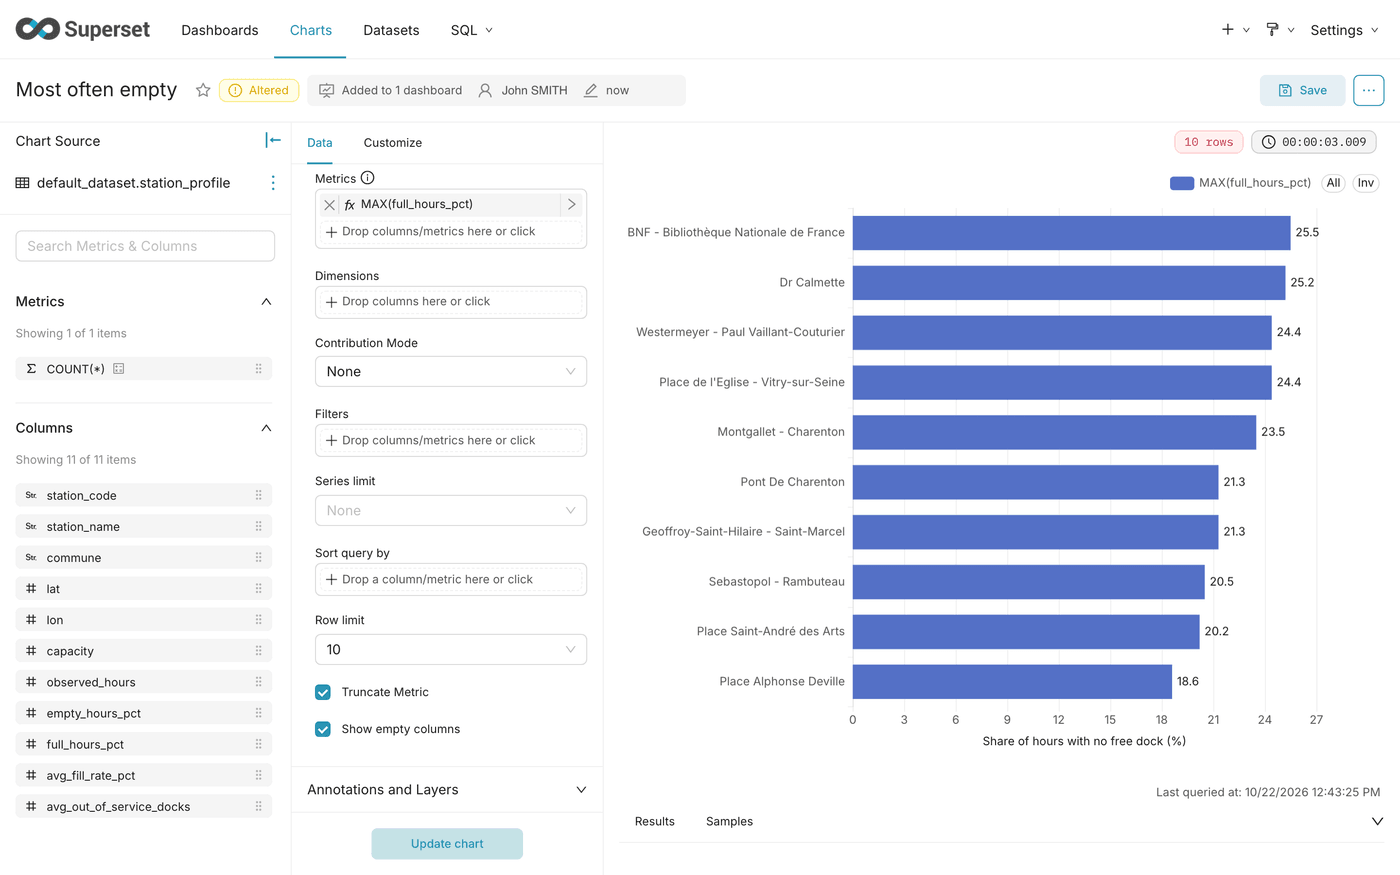
Most often full
The ten stations where users cannot return their bike, for lack of a free dock.
The quickest way is to start from the previous chart: change the metric and the axis title, click Save, select Save as... and enter the new name. The chart ranks the ten stations by their share of hours with no free dock.
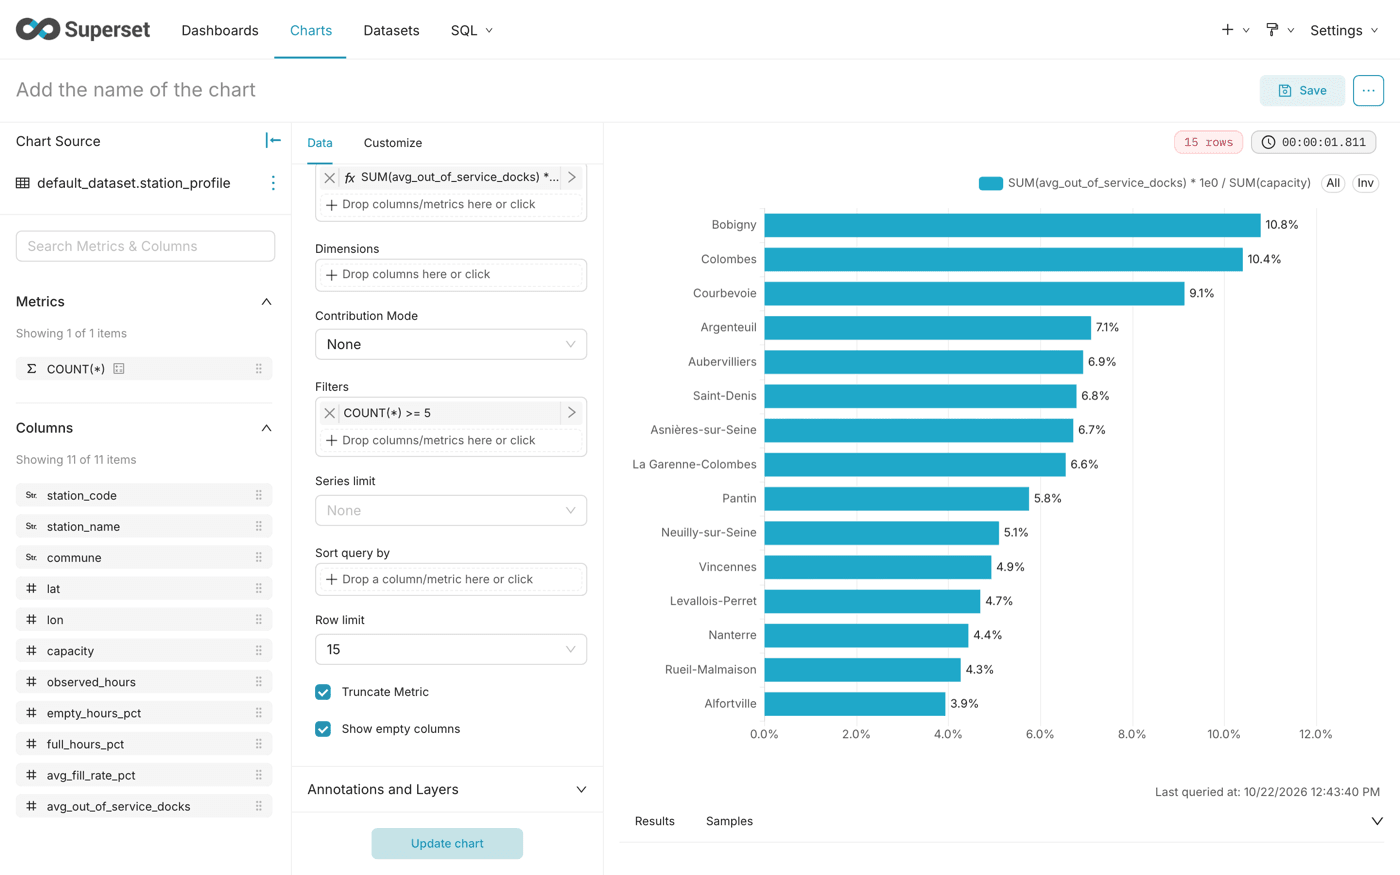
Docks out of service by commune
A maintenance view: where broken docks are, relative to the number of docks of each commune.
A share rather than a number of docks: the communes have very different numbers of stations, and the largest would dwarf the others in absolute numbers. The HAVING filter applies after the grouping by commune, and leaves out communes with fewer than 5 stations, where a single broken dock would push them to the top.
The chart ranks the communes by their share of docks out of service.
Step 4: Building the Trends tab
These charts use the dataset velib_daily: one row per day for the whole network. They need several days of collection.
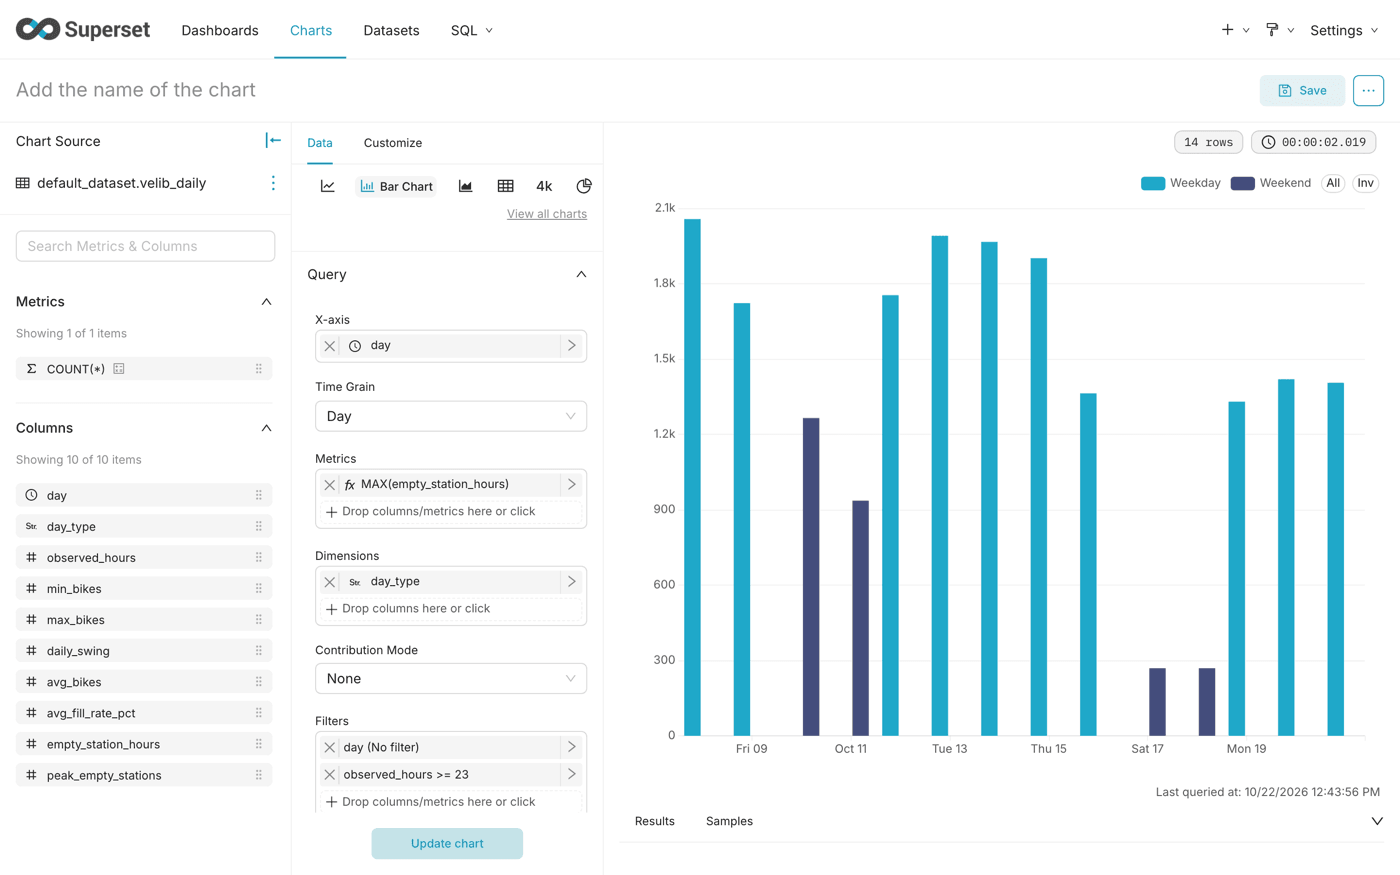
Empty station-hours per day
One bar per day: the total of hours spent empty by all stations, an indicator of how hard it was to find a bike that day.
Only complete days count: a day with a few hours of collection would have fewer empty hours, and could not be compared. The threshold of 23 hours rather than 24 tolerates one missed hour. The dimension day_type colours weekdays and weekends differently: weekends stay well below weekdays.
Many factors move these figures from one day to the next: the weather (rain and cold keep users off bikes), school holidays, public holidays, strikes or disruptions on public transport (which send more users to Vélib') and large events. A public holiday, such as 11 November, shows as a weekday, but should look like a Sunday. Compare similar days, and read a change over several days rather than on a single bar.
Daily figures
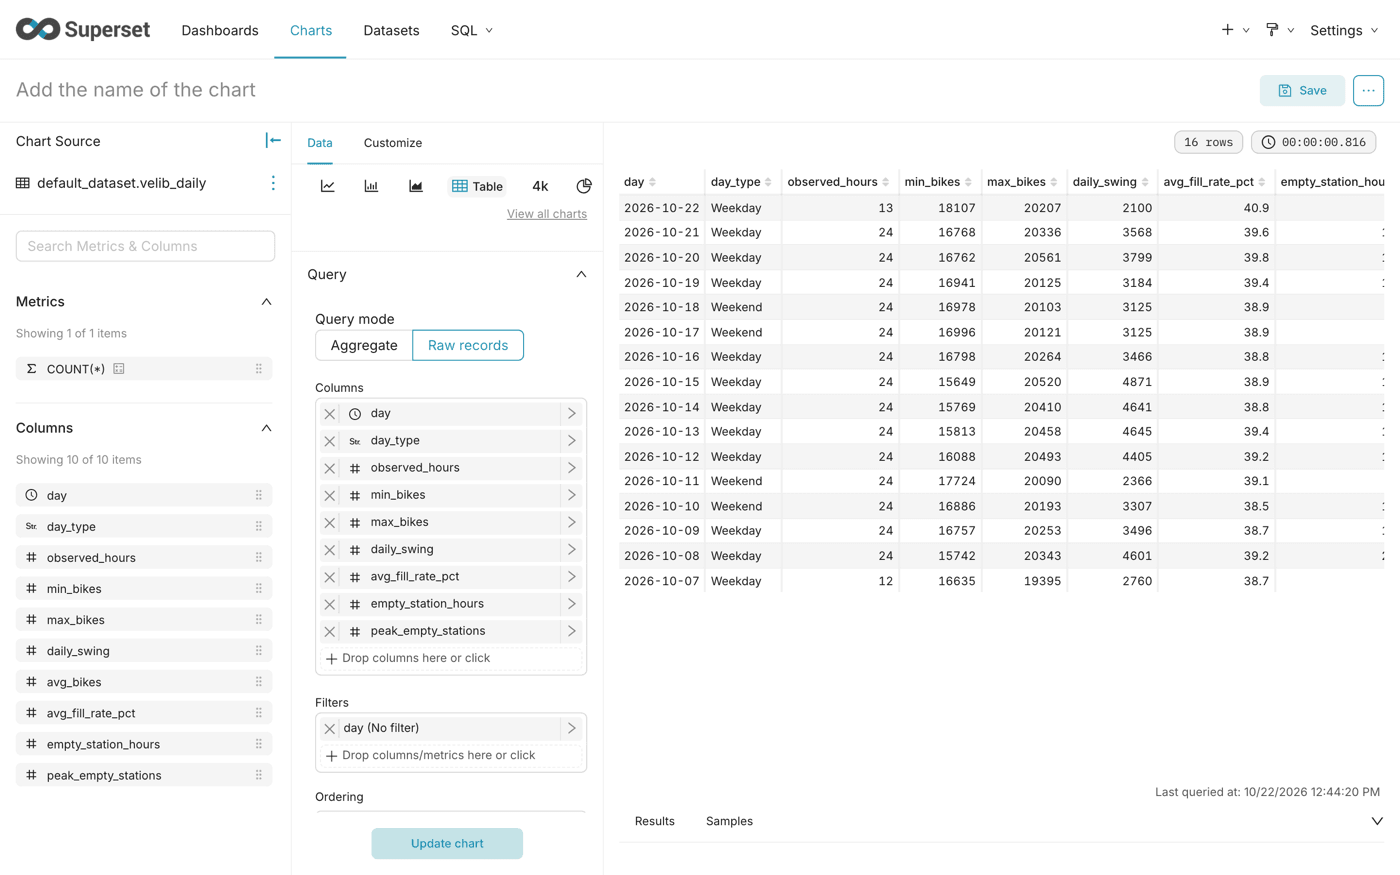
The full table of daily figures, to read the exact values behind the charts.
Unlike the previous chart, the table keeps incomplete days: the column observed_hours shows which days are complete, and reveals a day with missing collections. The first day of collection, which starts at noon in the screenshot, and the current day show fewer than 24 observed hours.
On a weekday, the network goes from about 20,000 parked bikes at night to about 16,000 to 17,000 at the busiest hour: some 3,000 to 5,000 bikes are in use at the peak.
Step 5: Assembling the dashboard
-
Open Dashboards, then the dashboard
Vélib' availability, and click Edit dashboard. -
From Layout elements, add a Tabs component with 4 tabs:
Now,Daily rhythm,StationsandTrends. -
From Charts, place the charts in each tab:
-
Click Save.
What you have built
You have a four-tab dashboard that turns a raw Vélib' history into answers: where to find a bike now, when the network is under strain, which stations fail their users most often, and how each day compares to the others.
From here you can add dashboard filters on commune, or apply the same pipeline to another public API that only gives a current state. For another Superset dashboard built on Data Platform, see Build a sales dashboard for an online store in Superset.
Go further
For training or technical assistance implementing our solutions, contact your sales representative or visit our Professional Services page to request a quote and have your project analysed by our experts.
Ask questions, give your feedback and interact directly with the team building the Data Platform on the dedicated Discord channel.
If you need support with your OVHcloud services, create a request in our Help Centre.
Join our community of users.