
Understanding vScope
The vScope interface allows you to monitor your infrastructure
Objective
OVHcloud provides you with a supervision and monitoring tool for your virtual machines and infrastructure: vScope.
This web interface gathers all the essential information about your resources.
This guide explains how to read and use the vScope interface.
Requirements
- You must be an administrator contact of the Hosted Private Cloud infrastructure, in order to receive login credentials.
- An active user ID (created in the ).
OVHcloud Control Panel Access
- Direct link:
- Navigation path:
Hosted Private Cloud>Managed VMware vSphere> Select your vSphere service
Instructions
Accessing vScope
-
Select your PCC service.
-
In the
General informationtab, scroll down and click thevScopelink.
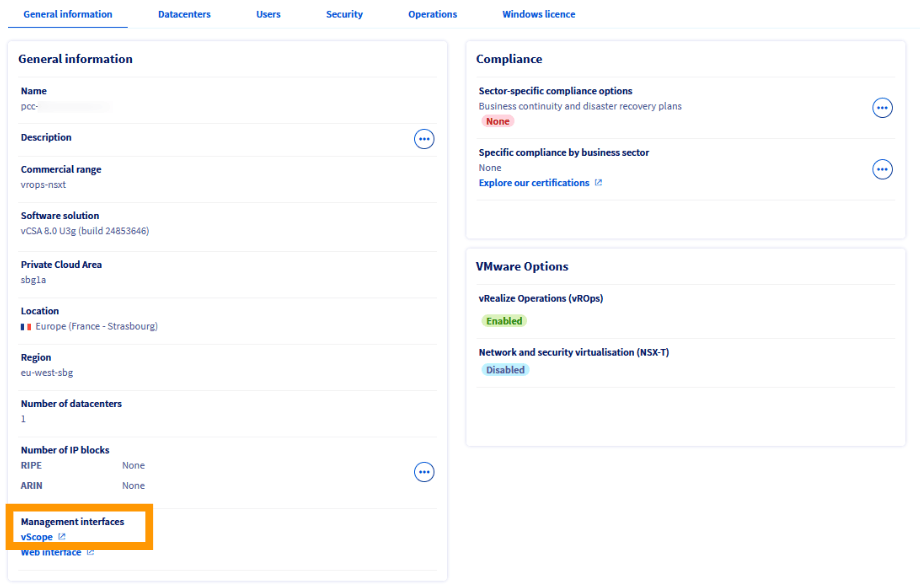
The interface opens in a new tab in your browser.

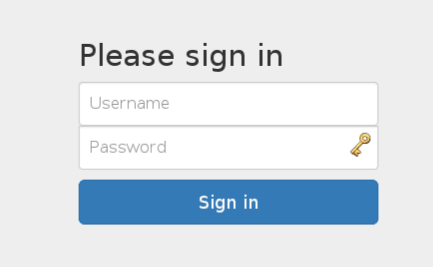
Log in with your user and password - the same credentials you use to connect to the vSphere client.
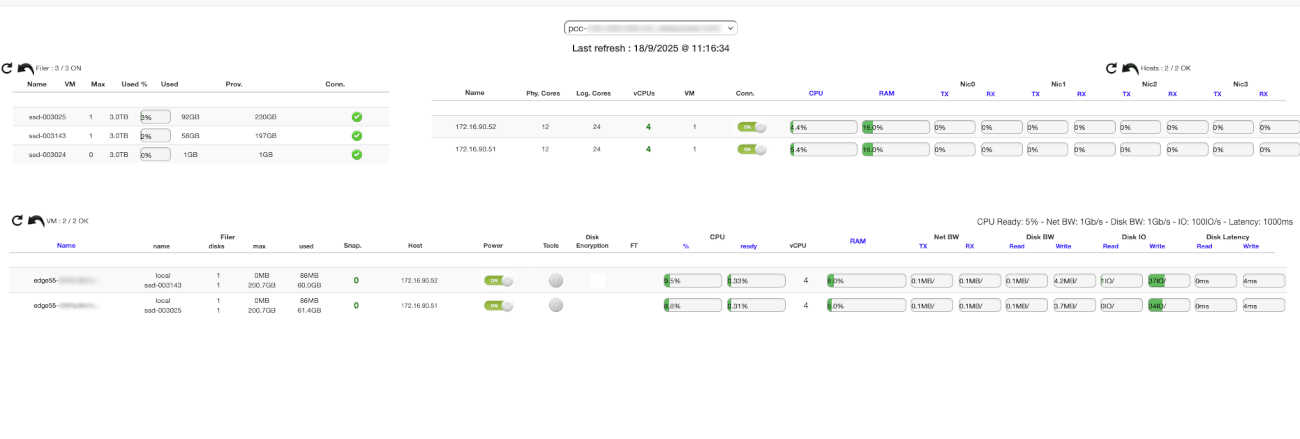
You are now connected to vScope. This page centralises the key information about your resources.
For example, for each host, you can immediately view:
- The number of cores and VMs
- CPU and RAM usage
- Network traffic
Browsing vScope
Selecting the datacenter
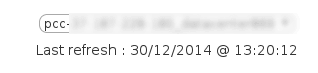
If your Hosted Private Cloud contains several datacenters, select the one you want to display from the drop-down menu.
The Last refresh field corresponds to the last refresh of the web page, not of vScope data. vScope data is automatically updated every 2 to 5 minutes.
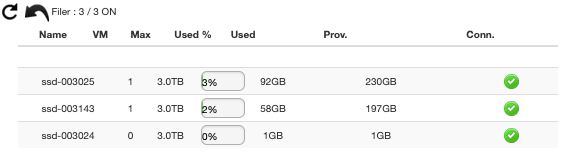
Filer menu
The Filer menu shows the usage of your datastores: number of virtual machines and consumed storage space.
Use this view to anticipate extension needs or monitor load balancing.
Hosts menu
The Hosts menu details the characteristics of each host in your datacenter:
- Number of cores, vCPUs and VMs
- CPU and RAM usage percentages
- Network connectivity
- Number of physical network cards (VMNic)

Virtual machines menu
This section provides a detailed view of each virtual machine:
- Status of VMware Tools
- Network traffic
- VM size
- FT (Fault Tolerance) activation
- CPU Ready Time
- Disk IO
- Disk latency

Go further
For training or technical assistance implementing our solutions, contact your sales representative or visit our Professional Services page to request a quote and have your project analysed by our experts.
Join our community of users.