Observability on OPCP
Discover the OPCP observability stack - metrics with Prometheus and Grafana Mimir, logs with Loki and Grafana Alloy, dashboards, retention periods and access rights
Objective
Your OVHcloud On-Prem Cloud Platform (OPCP) ships with a built-in observability stack that collects, stores and exposes the metrics and logs of the whole platform: the control plane, the OpenStack services, the Ceph clusters, the Cloud Store, the bare metal nodes and the compute hypervisors.
This guide describes that stack: which components it is made of, which interfaces you can reach, how long your data is kept, and which behaviours can be adapted to your needs.
Requirements
- A delivered and operational On-Prem Cloud Platform service
- A Keycloak account holding at least the
dc_operatorrole (see IAM rights management) - The base domain name (
base_dns_name) assigned to your platform at delivery - Administrative access to the OPCP controller with
opcp-cli, if you manage the platform yourself (see How to manage the OPCP configuration with opcp-cli)
Instructions
Observability architecture
The stack is built entirely on open-source Grafana Labs and Prometheus components, in their community (OSS) editions. It is split into two independent pipelines — one for metrics, one for logs — that converge in a single Grafana interface. An alerting layer sits on top of the metrics pipeline: the Mimir ruler evaluates the alerting rules shipped with the platform and hands the firing alerts over to Alertmanager, an optional component that routes the notifications to your own tools (see "Alerting").
Metrics pipeline
Both collectors push their series to Mimir through the Prometheus remote_write protocol, over the metrics.<base_dns_name> endpoint. Mimir is therefore the single place where the metrics of the entire platform — control plane and compute — are consolidated.
The exporters feeding this pipeline include node-exporter (control plane and compute hosts), kube-state-metrics (control plane workloads), openstack-exporter (OpenStack services), the Ceph exporters, blackbox-exporter (endpoint probing) and x509-certificate-exporter (certificate expiry).
Logs pipeline
Alloy ships its streams to Loki over the loki.<base_dns_name> endpoint. The logs of the compute nodes are not sent to Loki by default: see "Centralising the compute node logs in Loki".
Alerting
A predefined set of alerting rules is shipped with the product, ready to use with no configuration on your side. These rules cover the control plane, the OpenStack services, Ceph, the bare metal controllers (BMC), the GitOps engine and the certificates. They are evaluated centrally by the Mimir ruler, which reads them from the platform and runs them against the consolidated metrics.
Firing alerts are handed over to Alertmanager, which takes care of deduplication, silences and notification routing towards your on-call system. Alertmanager is an optional component that is not deployed by default. It is deployed when alert notifications are enabled on your platform, or when the platform is monitored by the OVHcloud on-call team; its interface is then published at alertmanager.<base_dns_name>. When it is not deployed, the rules are still evaluated but no notification is emitted. To send the notifications to your own tools, see "Sending alert notifications".
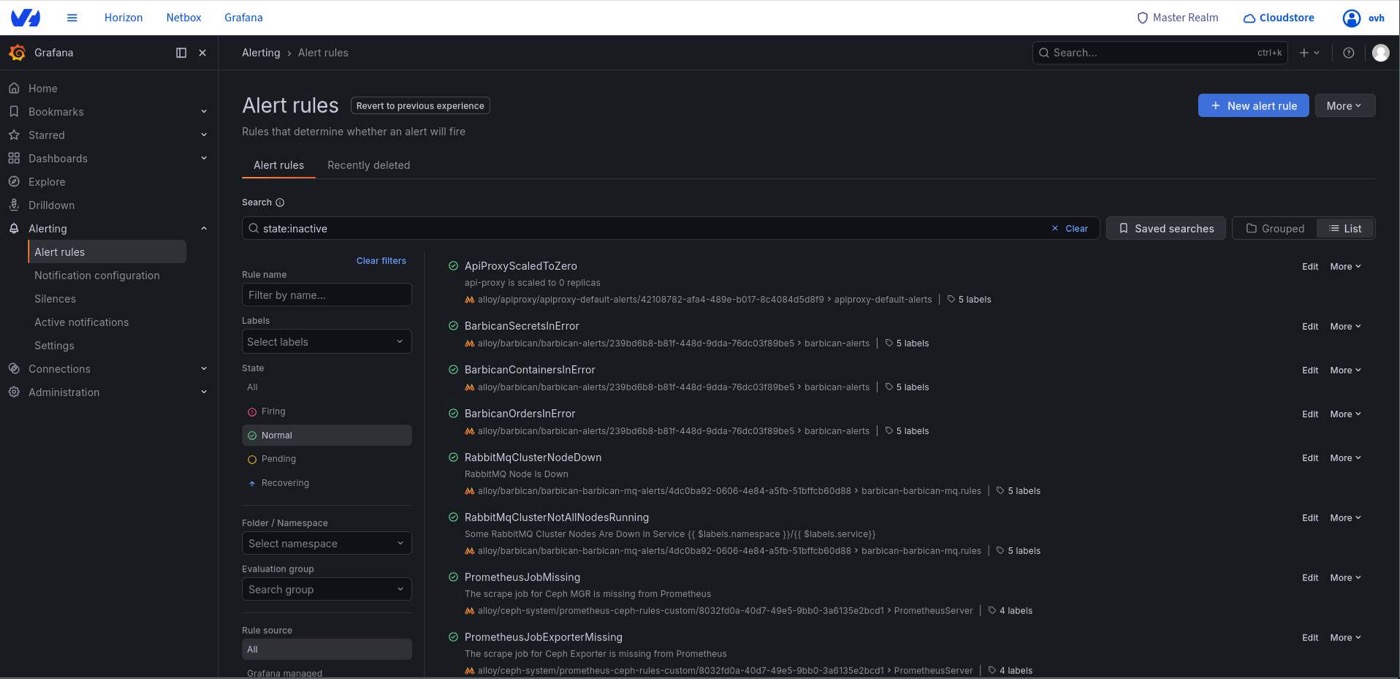
In Grafana, the rules evaluated by the Mimir ruler are listed in Alerting > Alert rules, with their state (normal, pending or firing).
Accessing the interfaces
All the interfaces below are published under the base domain name of your platform and are protected by Keycloak authentication.
Two additional endpoints are used for ingestion — they accept writes from the platform's own agents and are not browsable interfaces:
https://metrics.<base_dns_name>— metrics ingestion into Mimir. When the read-only query API is enabled, it also serves PromQL queries under/prometheus.https://loki.<base_dns_name>— log ingestion into Loki
Sending data from third-party agents to the ingestion endpoints is forbidden: these endpoints are reserved for the platform's own collection.
Access rights
Grafana access is driven by the role held by your account in Keycloak. The mapping is re-evaluated at every login, and an account with no observability role is denied access entirely.
The reader role has read access to Prometheus but not to Grafana. The full matrix across every application of the platform is documented in IAM rights management.
Exploring your data in Grafana
Data sources
Three data sources are provisioned in Grafana:
Mimir is the default data source, so a new panel queries the consolidated, long-retention store unless you change it explicitly. Both Mimir and Prometheus speak PromQL, so a query written against one runs unchanged against the other.
Exploring the logs
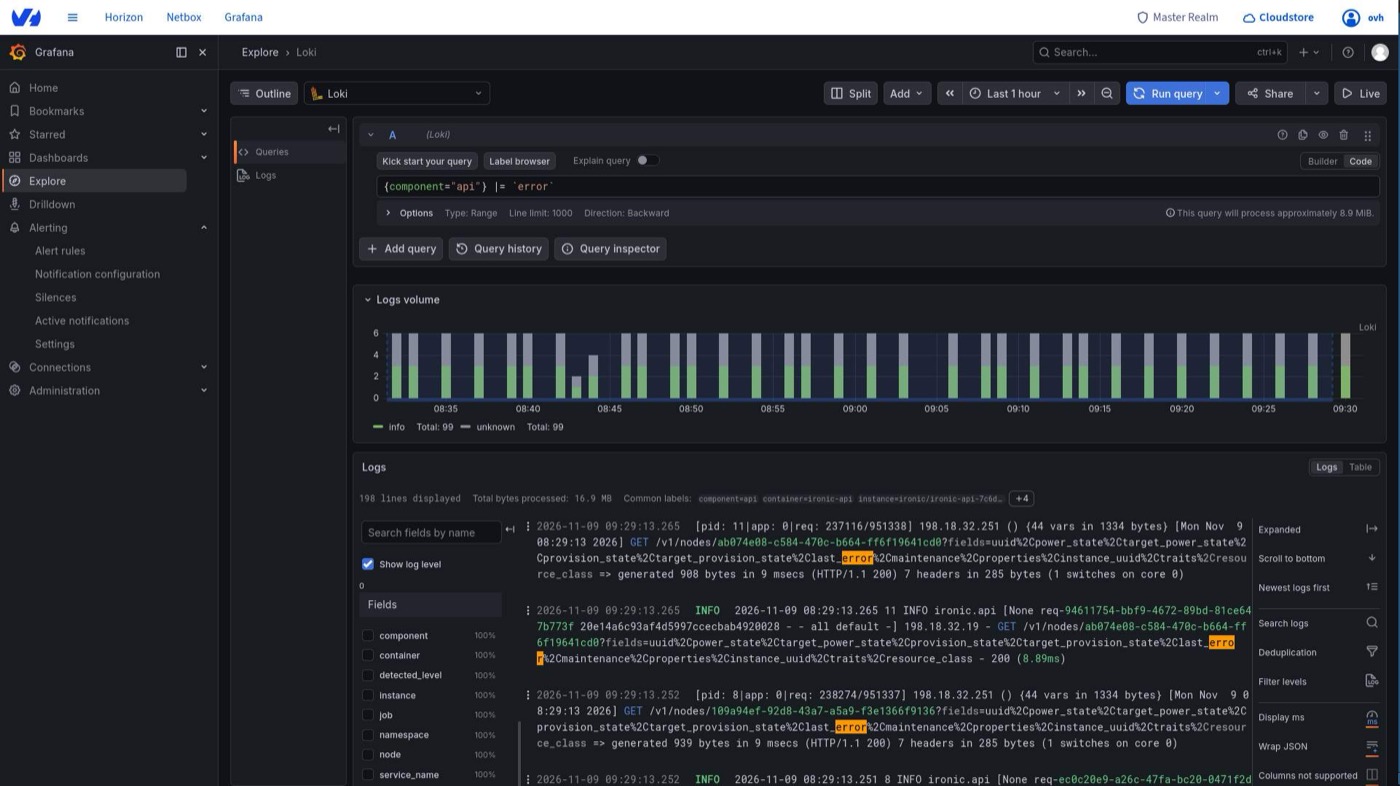
To read the logs, open Explore in the Grafana menu and select the Loki data source:
-
Use the
Label browser, or theBuildermode, to select the logs by label, for instance bynamespaceorcontainer. -
Add a filter on the content of the lines if needed. In
Codemode, the query{component="api"} |= "error"returns the lines that containerrorin the logs of the API containers. -
Select the time range and click
Run query.Grafana displays the volume of logs over the period, then the matching lines. Click a line to see its labels.
Dashboard folders
The dashboards shipped with the platform are organised into folders:
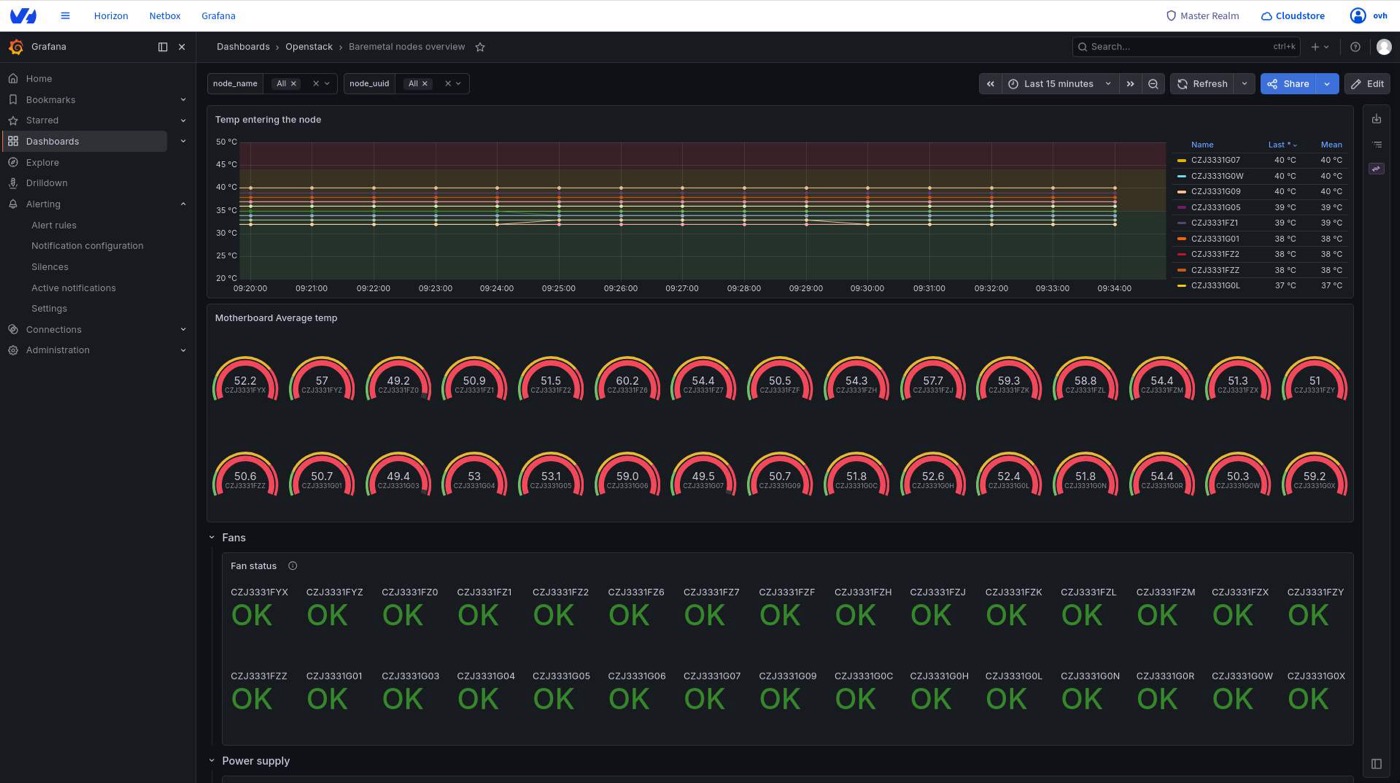
For instance, the Baremetal nodes overview dashboard of the Openstack folder gives a view of the bare metal fleet: temperatures, fans and power supplies of each node.
With an it_admin account or higher, you can create your own dashboards directly in the Grafana interface, or import them from a JSON file (Dashboards > New > Import). Store them in a folder of your own: the folders listed above are provisioned by the platform and reconciled with it, so any manual change to them is reverted.
The dashboards you create are stored in the Grafana database, on a persistent volume that is included in the platform backups of the persistent volumes (see How to update the backup S31 buckets). They are therefore restored with the platform, at the state of the last backup. To keep a versioned copy, or to deploy the same dashboards on several platforms, also export them as JSON (Share > Export) and keep them in a repository of your own.
Data retention
Each stage of the pipeline keeps data for a different period. The value that matters for historical analysis is the Mimir one.
Prometheus only keeps a short local buffer because every series it scrapes is immediately forwarded to Mimir. Queries covering more than a few days should target the Mimir data source.
Adapting the stack to your needs
The following behaviours can be adapted on your platform. On an OVHcloud-managed platform, request the change through your usual support channel; on a self-managed platform, apply it in your platform configuration.
- Log retention — the period during which Loki keeps your logs, 7 days by default, see "Log retention".
- Log forwarding — the platform can forward its logs to an external collector, either to your own syslog servers or to the OVHcloud Logs Data Platform service, see "Forwarding logs to an external collector".
- Custom alerting rules — the alerting and recording rules can be sourced from a Git repository you own, instead of the rules shipped with the platform, see "Sourcing the alerting rules from a Git repository".
- Metrics storage — the long-term metrics can be stored in an external S3-compatible bucket, such as an OVHcloud Public Cloud Object Storage bucket, instead of the platform object storage, see How to store the OPCP metrics in an external S3 bucket.
- Custom dashboards — you can create and manage your own dashboards in the Grafana interface, see "Dashboard folders". They are included in the platform backups, with no Git repository required. The dashboards and the alerting rules shipped with the platform are managed as code (IaC): they are defined in the platform configuration and continuously reconciled, so any manual change to them is reverted. Keep your own dashboards in a folder of your own, and your own alerting rules in your own Git repository (see above).
- Ingestion capacity — the metrics ingestion path is sized at delivery for the size of your platform. Adding a significant number of nodes may require it to be resized, see "Default limits". It is reserved for the platform's own collection: pushing metrics from your own workloads is not allowed.
- External Grafana — the consolidated metrics can be queried from a Grafana instance of your own, see "Querying the metrics from an external Grafana".
- Metrics forwarding — a copy of the control plane metrics can be sent to an external Prometheus-compatible endpoint, see "Forwarding metrics to an external endpoint".
- Compute node logs — the logs of the compute nodes can be centralised in the platform Loki, see "Centralising the compute node logs in Loki".
- Alert notifications — the alerts can be sent to your own email, chat or incident management tools, see "Sending alert notifications".
Shipping your own observability components into the platform stack is not allowed: do not deploy your own exporters, collection agents, Grafana plugins or provisioned dashboards inside the platform, and do not modify its monitoring components. Such changes are not supported, may be reverted at the next reconciliation or upgrade, and may disrupt the monitoring of the platform. To go further, use the integration points described in this guide: an external Grafana, metrics or logs forwarding, alert notifications.
Optional integrations
The integrations below are disabled by default. On a self-managed platform, you enable them from the OPCP controller with opcp-cli:
- the settings are changed with
sudo opcp-cli config edit, then applied withsudo opcp-cli deploy --system; - the credentials are stored in the platform secrets, which you read and update with
sudo opcp-cli secrets passwords --edit(keys understringData).
On an OVHcloud-managed platform, request the change through your usual support channel.
The secrets keys mentioned below are created by sudo opcp-cli secrets passwords --generate. If a key is missing on your platform, run this command once with an up-to-date opcp-cli: existing secrets are kept, only the missing keys are added.
Querying the metrics from an external Grafana
Mimir can expose a read-only Prometheus query API on the metrics endpoint, so that a Grafana instance of your own can query the consolidated metrics of the platform. Only the query paths (/prometheus/api/v1/...) are published: the Mimir rules configuration API stays unreachable, and the API is protected by credentials distinct from the ingestion ones and by a per-source-IP rate limit.
1. Enable the API with sudo opcp-cli config edit:
Then apply it with sudo opcp-cli deploy --system.
2. Retrieve the password with sudo opcp-cli secrets passwords --edit: it is stored under the metrics_read_password key. To change it, update the value in the same editor and save.
3. In your Grafana, add a Prometheus data source:
The URL must end with /prometheus, without a trailing slash. Any other path, such as https://metrics.<base_dns_name> alone, returns a 404 Not Found error when testing the data source.
You can check the access from any host with curl:
Forwarding metrics to an external endpoint
The control plane Prometheus can send a copy of its series to an external Prometheus-compatible endpoint (a central Mimir, Prometheus, Thanos, etc.) through the remote_write protocol, in addition to the platform Mimir. The copy uses its own queue: an outage of the external endpoint does not delay the ingestion into the platform Mimir. The same cardinality filter as for the platform Mimir is applied.
1. Configure the endpoint with sudo opcp-cli config edit:
2. Set the basic-auth credentials of the external endpoint with sudo opcp-cli secrets passwords --edit, under the metrics_external_remote_write_username and metrics_external_remote_write_password keys. These keys are generated with random placeholder values: replace them with the credentials provided by the owner of the endpoint. The same command lets you read or change them later.
3. Apply the configuration with sudo opcp-cli deploy --system.
The external endpoint must:
- be reachable from the control plane over HTTPS, through a host name (an IP address is not accepted);
- present a certificate trusted by the platform: issued by a public certificate authority, or by a CA you added to the platform trust store.
To check the forwarding, query the up series on the external endpoint, or look at the prometheus_remote_storage_samples_failed_total metric of the control plane Prometheus.
Forwarding logs to an external collector
The log forwarder is an agent deployed on every control plane node and every compute node. It collects the systemd journal and the container logs of the node, and sends them to your own syslog servers, to the OVHcloud Logs Data Platform service, or to both. It is independent from the Loki pipeline: the control plane logs stay available in Grafana whatever the forwarding destinations.
The logs are buffered on the node (up to 4 GB per destination) and retried when a destination is temporarily unreachable.
Forwarding to syslog servers
1. Declare your syslog servers with sudo opcp-cli config edit:
2. Apply the configuration with sudo opcp-cli deploy --system.
The messages are sent in the RFC 5424 format. No secret is involved: the syslog servers must accept the connections coming from the platform without authentication. In tls mode, the server certificate must be issued by a public certificate authority, unless tls_verify is set to off.
Forwarding to Logs Data Platform
1. In your Logs Data Platform account, create a stream and retrieve its write token and the address of your cluster.
2. Store the token in the platform secrets with sudo opcp-cli secrets passwords --edit, under the ldp_token key (add the key under stringData if it does not exist yet). The same command lets you read or rotate the token later.
3. Enable the destination with sudo opcp-cli config edit:
4. Apply the configuration with sudo opcp-cli deploy --system.
Every log record carries a LOG_SOURCE field set to the region name of the platform, which lets you tell several platforms apart in the same stream.
When Octavia is enabled, the logs of the load balancer instances (amphorae) are forwarded to the same destinations.
To check the forwarding, open the Fluent Bit dashboard in the Control plane components folder of Grafana, which shows the throughput, errors and retries of each output. The LogForwarder-NoOutputBytesProcessed alert fires when an output stops sending logs.
Centralising the compute node logs in Loki
By default, the logs of the compute nodes are only sent to the destinations of the log forwarder (syslog or Logs Data Platform). They can also be pushed to the platform Loki, so that they can be explored in Grafana next to the control plane logs.
Enable it with sudo opcp-cli config edit, then apply it with sudo opcp-cli deploy --system:
No secret has to be set for this integration: the compute nodes authenticate on Loki with the platform's internal ingestion credentials, which are managed automatically. There is therefore nothing to retrieve or update with sudo opcp-cli secrets passwords.
In Grafana, the compute logs are found in the Loki data source with the opcp_context="compute" label, and each compute node is identified by the cluster label. The host, unit, level, namespace and container labels follow the same naming as for the control plane logs.
The compute logs share the Loki storage and retention of the control plane logs. On a large platform, the extra volume may require the Loki storage or retention to be adapted.
Sending alert notifications
Alertmanager can notify your own tools of the alerts raised by the platform: email, chat (Slack, Microsoft Teams, Mattermost, etc.), incident management (PagerDuty, OpsGenie, etc.) or any HTTP webhook. The integrations available natively in the community edition of Alertmanager are listed in the official documentation; for a tool that is not supported natively, the Prometheus project lists third-party webhook receivers. Enabling the alert notifications also publishes the Alertmanager interface at alertmanager.<base_dns_name>, from which you can follow the firing alerts and create silences.
The receivers and routes are written in the Alertmanager configuration syntax. The alerts are grouped by alertname, namespace, severity and opcp_context, among others, and these labels can be used in the routes.
1. Store the credentials of your receivers in the platform secrets with sudo opcp-cli secrets passwords --edit: add one key per credential under stringData, for instance alertmanager_smtp_password. Use a name of your choice, made of lowercase letters, digits and underscores. The same command lets you read or rotate them later. The keys you add are kept when sudo opcp-cli secrets passwords --generate runs again, unless you use its --clean option.
2. Describe the receivers with sudo opcp-cli config edit, and reference each credential as ${<key>}:
3. Apply the configuration with sudo opcp-cli deploy --system.
The receiver settings go through the variable substitution of the platform: any $ followed by a name is replaced by the secret of the same name, or by an empty string. Do not use $ variables in the receiver settings: put such templates in a template file, see "Customising the notification content".
When the platform is monitored by the OVHcloud on-call team, the alerts keep being sent to that team: your routes are evaluated in addition to its route, never instead of it.
To check the configuration, open https://alertmanager.<base_dns_name>: the Status page shows the configuration loaded by Alertmanager. The always-firing Watchdog alert is used internally to check the alerting pipeline and is never sent to your receivers.
Customising the notification content
By default, each receiver sends the built-in Alertmanager message. The platform also ships ready-made templates that any receiver can use:
Reference them in the receiver fields that accept a template:
To write your own templates, add template files under templates, in the Alertmanager notification template syntax. Unlike the receiver settings, these files are not altered by the variable substitution, so they can use $ variables:
Apply the changes with sudo opcp-cli deploy --system: Alertmanager reloads the templates without restarting. The following rules apply:
- every file name must end with
.tmpl, otherwise the deployment is refused; - the
opcp.*andopsgenie.*template names belong to the platform: a template of yours with one of these names is ignored. To adapt a default template, copy it under a name of your own, for instancecustomer.html. On a self-managed platform, read the default templates withkubectl -n monitoring get configmap alertmanager-templates -o yaml.
A template error is only detected when a notification is sent: the notification is then not delivered. After changing a template, check the Alertmanager logs and the alertmanager_notifications_failed_total metric in Grafana, ideally while a test alert is firing.
Sourcing the alerting rules from a Git repository
The alerting and recording rules (PrometheusRule objects) can be read from a Git repository you own instead of the platform, so that every change goes through your own review process. Enable it with sudo opcp-cli config edit:
This repository replaces the rules shipped with the platform: it must contain the platform rules as well as your own, and the rules shipped with later releases must be merged into it at each upgrade.
Before enabling it, contact OVHcloud support for the prerequisites: access to the repository and its expected layout.
Known limitations
- Single tenant. Mimir is operated as a single logical tenant: the control plane and every compute node share the same metrics space and the same ingestion quota. There is no per-team or per-project isolation of metrics. This stack is intended for the operation of the platform: for multi-tenant use, rely on the observability service of the Cloud Store, which is designed for it.
- No metrics redundancy by default. The Mimir ingestion path is deployed without replication by default. A platform requiring the loss of an ingestion component to be transparent must be sized for it at delivery.
- External query API. The read-only query API is rate-limited per source IP to protect the platform Mimir: heavy dashboards or wide queries from an external Grafana may receive
429 Too Many Requestsresponses. - Alertmanager is optional. Unless alert notifications were enabled on your platform (see "Sending alert notifications") or the platform is monitored by the OVHcloud on-call team, Alertmanager is not deployed: the rules are evaluated but no alert notification is emitted and no Alertmanager interface is published.
Default limits
The limits behind these behaviours are set in the monitoring.mimir section of the platform configuration. Their default values are:
MimirTenantSeriesApproachingLimit and MimirTenantSeriesNearLimit warn in advance, when the active series reach 70% then 85% of max_global_series_per_user. MimirSamplesDiscardedSeriesLimit is raised when samples are actually rejected, because of the series cap, the ingestion rate or the number of labels.
On a self-managed platform, override only the values to change with sudo opcp-cli config edit, for instance to keep the metrics longer and raise the ingestion limits:
Then apply it with sudo opcp-cli deploy --system. On an OVHcloud-managed platform, request the change through your usual support channel.
These values must be adapted together with the capacity of the control plane. Raising max_global_series_per_user increases the memory used by Mimir: budget about 4 GiB per million active series (up to 6 GiB during compaction). Extending the retention increases the space used in the object storage bucket.
Log retention
The log retention is set in the monitoring.loki section of the platform configuration. Its default values are:
On a self-managed platform, override them with sudo opcp-cli config edit, for instance to keep the logs for 14 days:
Then apply it with sudo opcp-cli deploy --system. On an OVHcloud-managed platform, request the change through your usual support channel.
The logs are stored on a volume of the control plane, not in an object storage bucket: when it is full, new logs are lost. Size the volume together with the retention, and with the log volume of your platform, which grows notably when the compute node logs are centralised in Loki. Enlarging the volume of an existing platform may require a manual intervention: contact OVHcloud support beforehand.
Go further
How to update the backup S3 buckets (example of a configuration change with opcp-cli)
How to manage the OPCP configuration with opcp-cli
Getting started with your OPCP
For training or technical assistance implementing our solutions, contact your sales representative or visit our Professional Services page to request a quote and have your project analysed by our experts.
Join our community of users.
1: S3 is a trademark of Amazon Technologies, Inc. OVHcloud's service is not sponsored by, endorsed by, or otherwise affiliated with Amazon Technologies, Inc.