
Collect Vélib' availability every hour with SQL only
Find out how to collect the availability of every Vélib' station in Paris every hour, build its history and model it with SQL views for Superset
Objective
This guide walks you through collecting the availability of every Vélib' station in Paris from a public API, every hour, building a clean history of it and modelling it with SQL views ready for Apache Superset. You connect the API with an HTTP REST source, create the history table in Lakehouse Manager, date and deduplicate each collection with Data Processing Engine, then model the history with views. Everything happens in the Data Platform interface and in SQL: not a single line of Python.
The Vélib' API only gives the current state of each station. By polling it regularly, you build the history it does not keep, and that history is what you analyse.
By the end you will have the table velib_raw, which grows on its own every hour, and five SQL views on top of it, ready to query from Apache Superset. The second part of the guide, Build a Vélib' availability dashboard in Superset, turns them into a dashboard.
Requirements
To follow this guide you need:
- a Data Platform project. This guide uses a project named
velib-availability. - nothing else to collect the data: the API is public and needs no account or key. Step 8 deploys an Apache Superset application, billed for the time it stays deployed: see Data Platform pricing.
About the data: Vélib - Vélos et bornes - Disponibilité temps réel, © Smovengo / Syndicat Autolib' Vélib' Métropole, published by Ville de Paris under the Open Database License (ODbL).
When you reuse these data, mention their producers and the ODbL licence. transport.data.gouv.fr applies special conditions of use to the share-alike clause of the licence: it only covers a derived database of the same nature, granularity, temporal conditions and geographic extent as the original data. Check these conditions before you publish data built from this dataset.
We recommend completing the Getting Started guides first. This guide assumes you are comfortable with the main components of Data Platform.
What you will build
Instructions
Step 1: Connecting the API
The dataset has an export endpoint that returns every station in one call:
The records endpoint shown in the API tab of Paris Data returns a limited number of results per call. The export endpoint returns every station at once: about 1,500 (1,519 on 22 October 2026).
-
Open Connectors > Sources and create a new source of type HTTP REST.
-
Name it
velib. -
In Base URL, enter
https://opendata.paris.fr/api/explore/v2.1/. Keep SSL Verify on and Authentication mode set to None, then click Connect.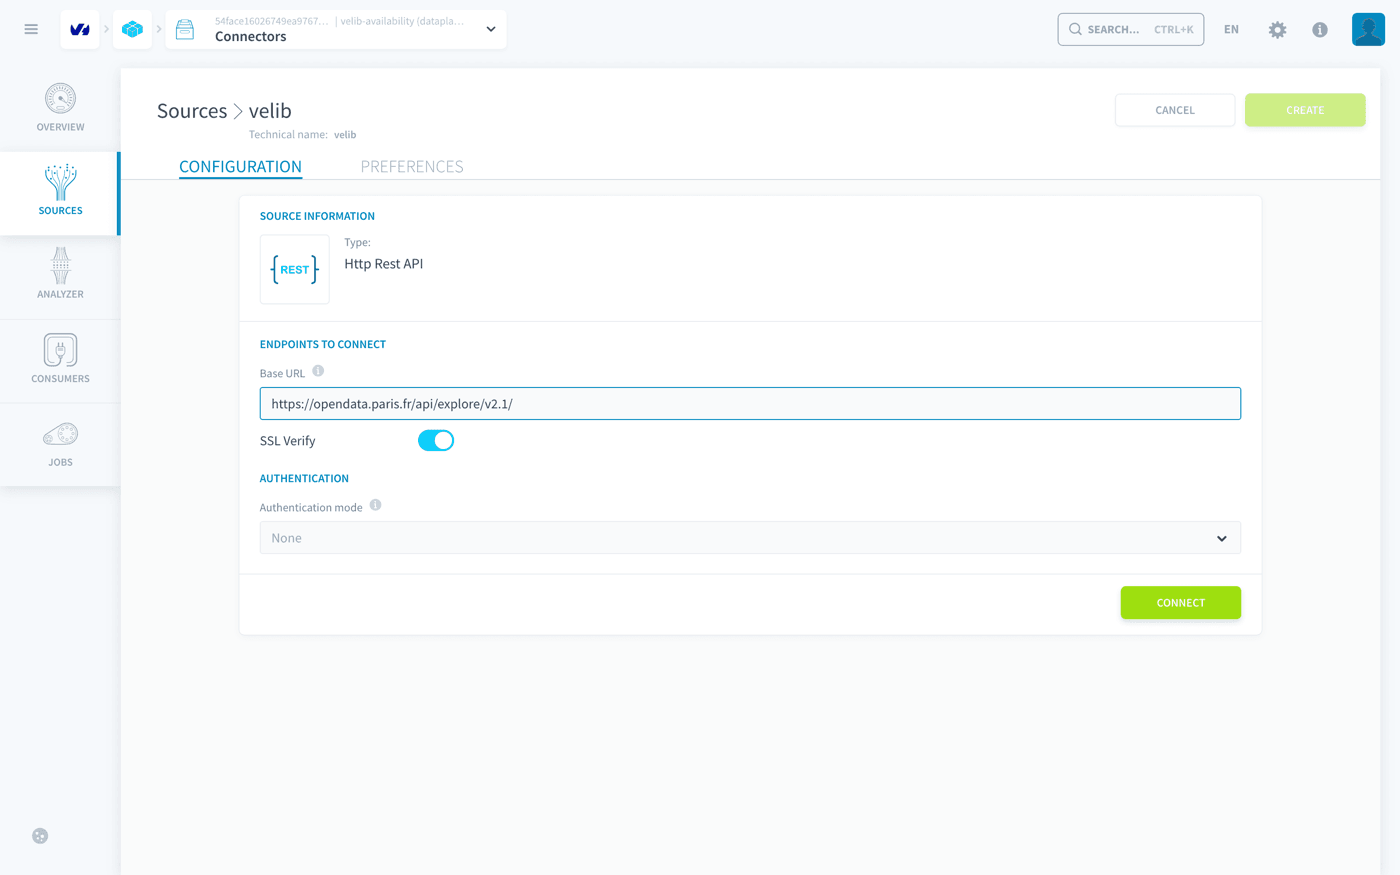
-
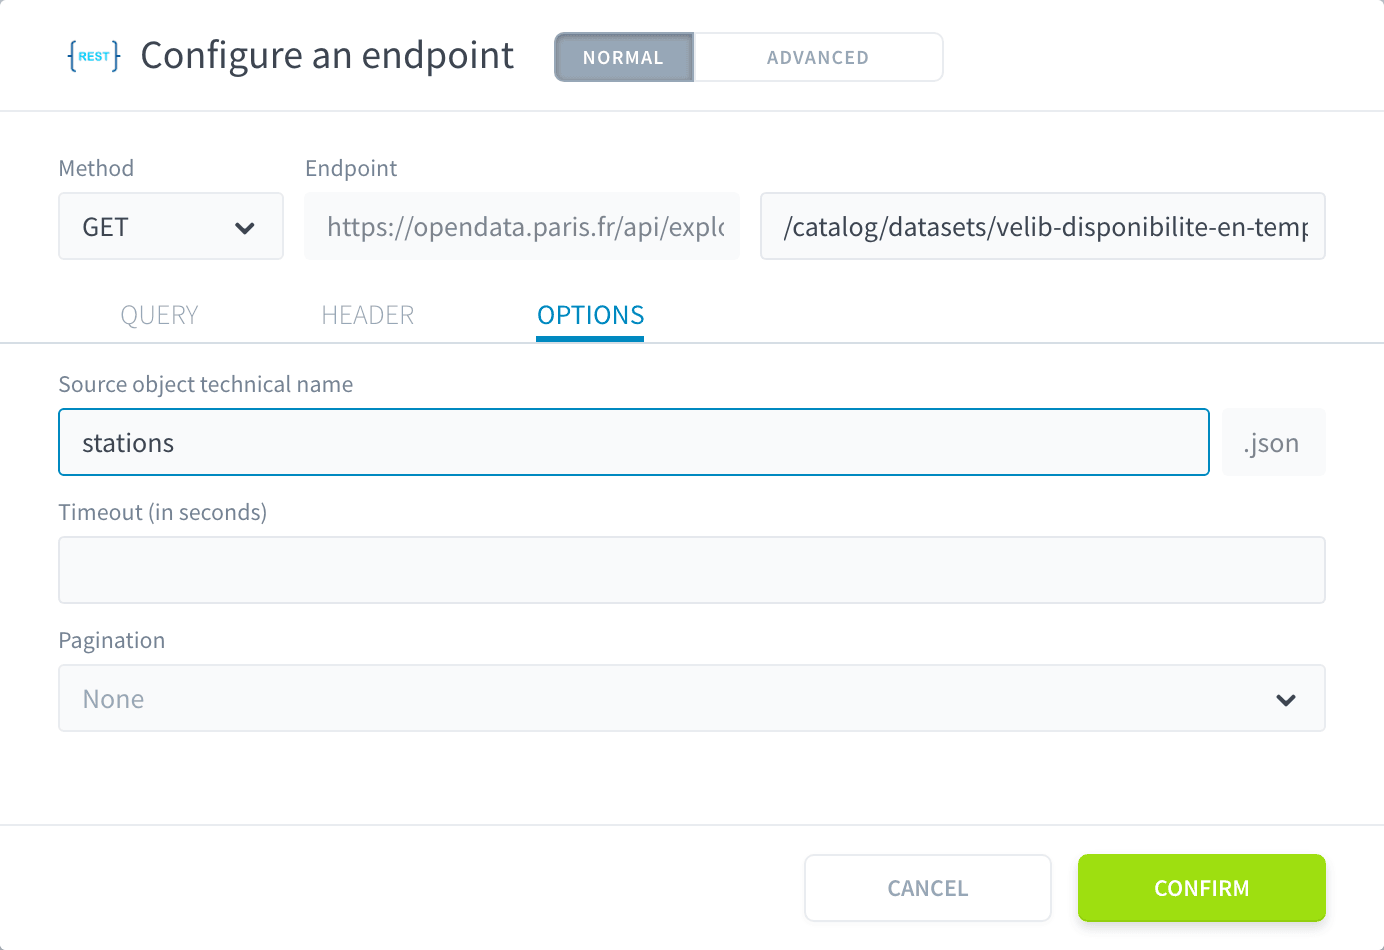
In Endpoints to connect, click Add an endpoint and fill in the endpoint:
-
Click Confirm.
-
Click Create.
The source lists one endpoint,
stations.json.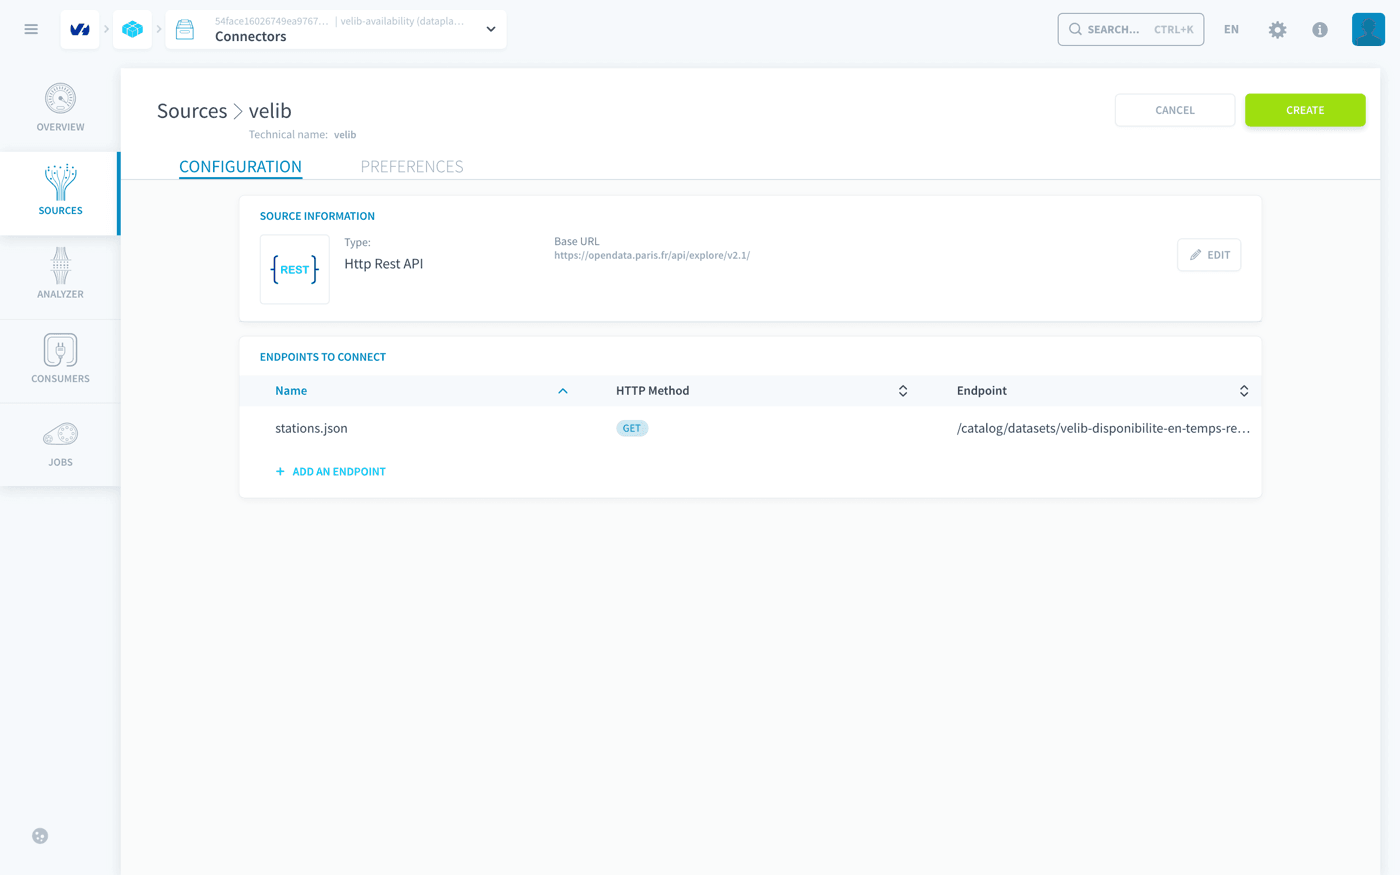
Each station comes with its availability and its description:
Step 2: Checking the attributes
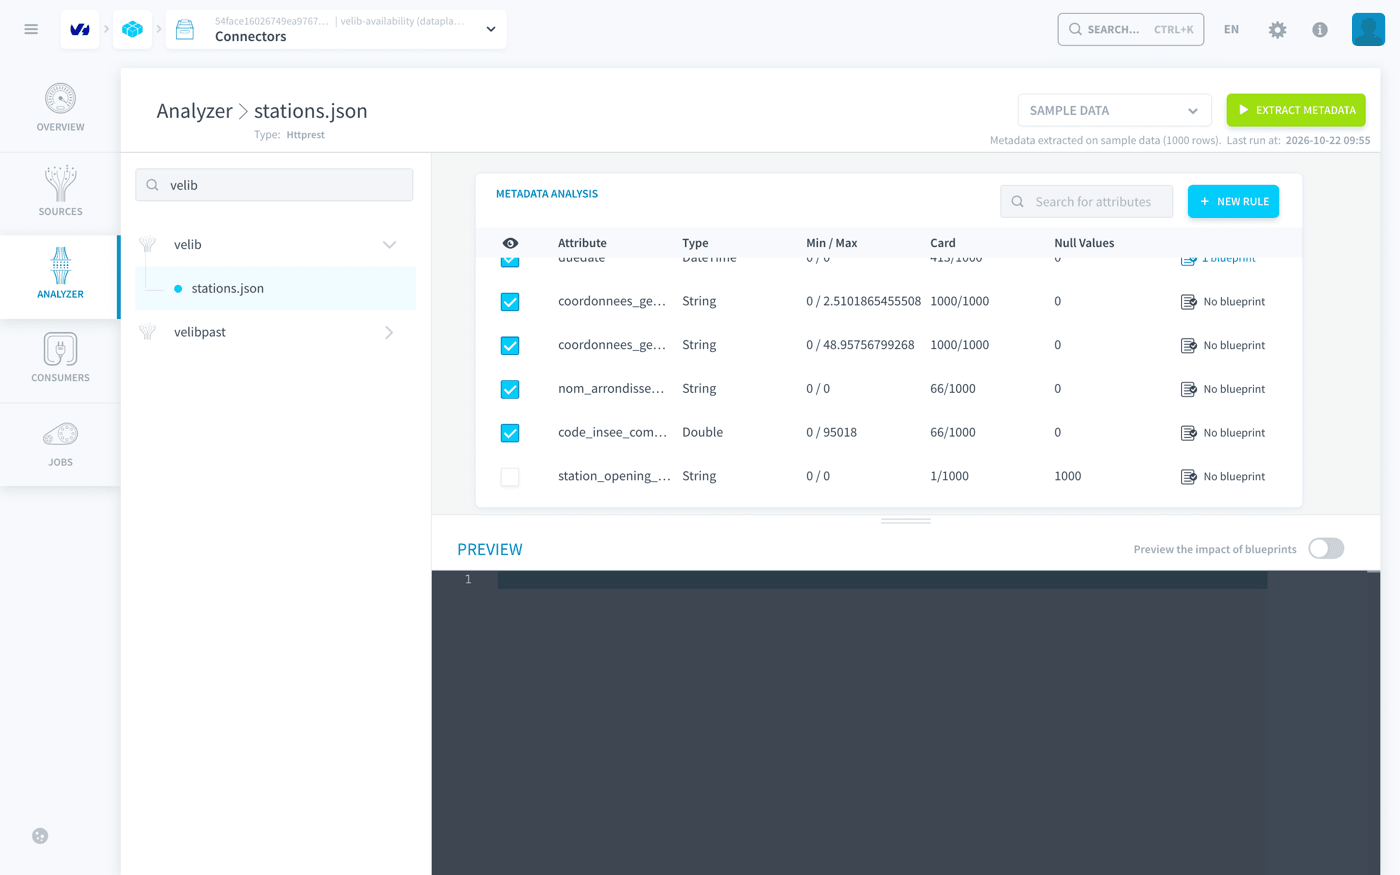
- Open Connectors > Analyzer.
- Select the source
velib, thenstations.json. - Click Extract metadata.
The Analyzer detects the types on a sample of 1,000 rows. Check them now: once the table is created, you cannot change the type of its attributes.
Step 3: Creating the history table
Creating the table
-
Open Lakehouse Manager > Tables and click New table > Create from a Connectors source.
-
Select
stations.jsonfrom the sourcevelib, then click Next.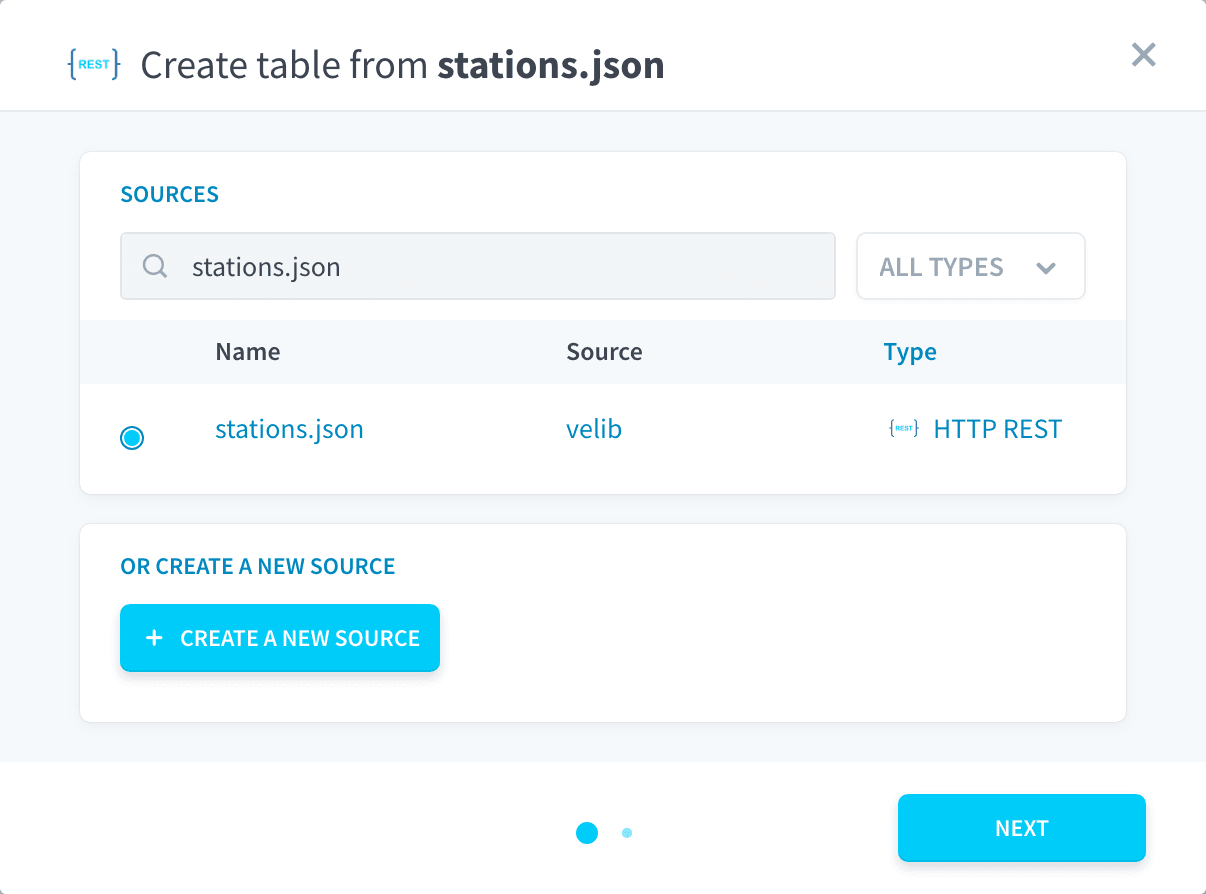
-
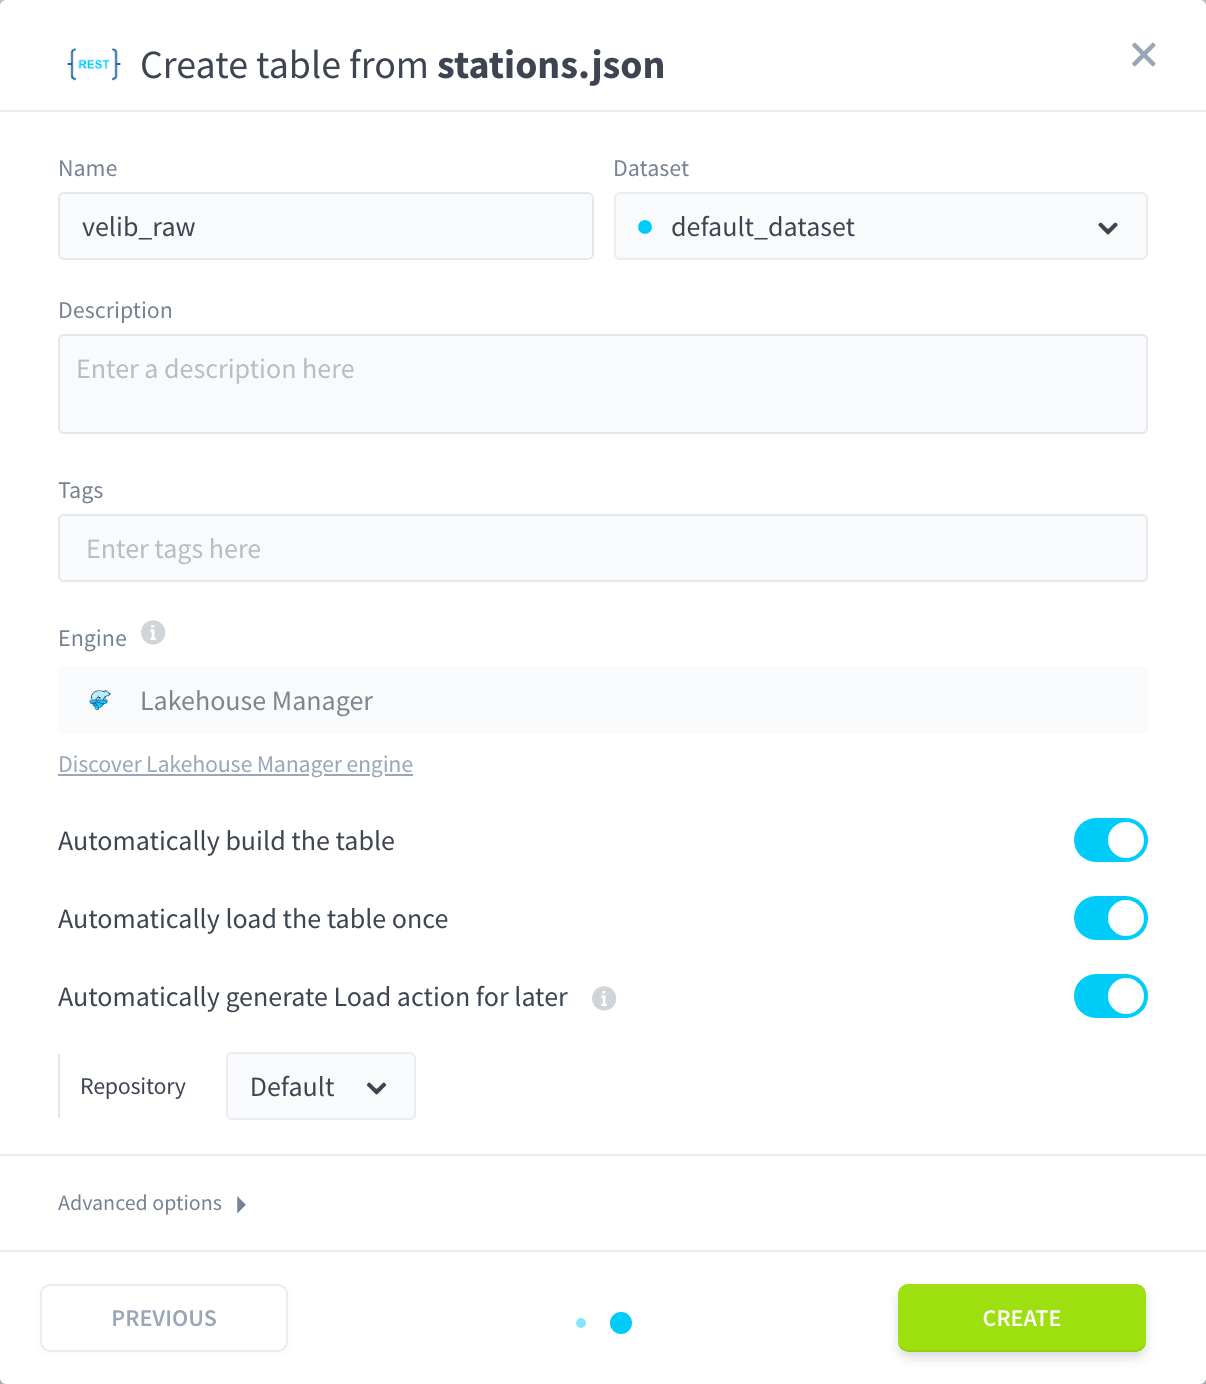
Name the table
velib_raw, keep the datasetdefault_dataset, and keep the three options turned on: Automatically build the table, Automatically load the table once and Automatically generate Load action for later. -
Click Create.
The table holds one row per station, about 1,500 rows. The nested coordinates become
coordonnees_geo_latandcoordonnees_geo_lon.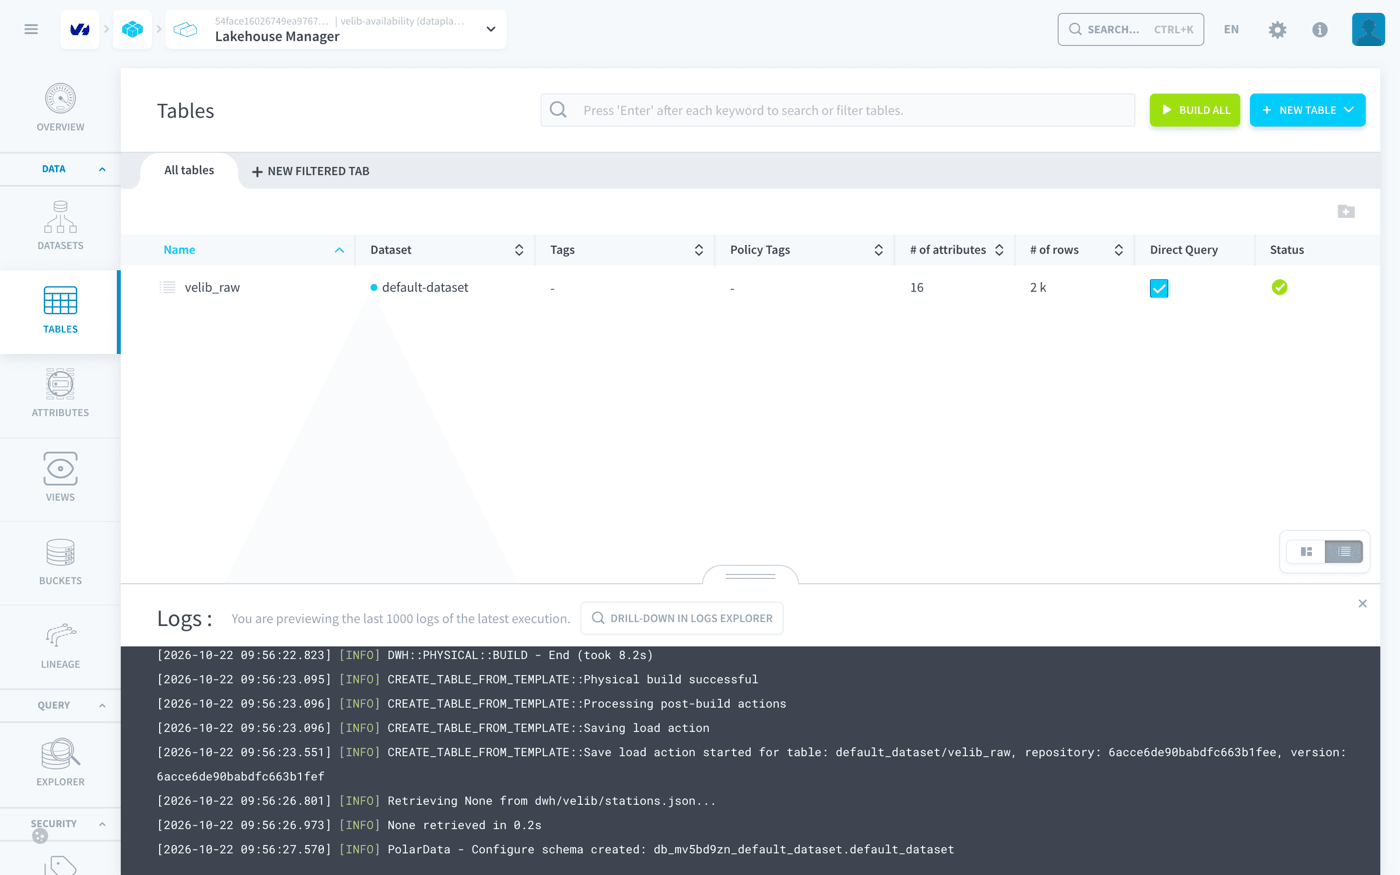
Adding the collection columns
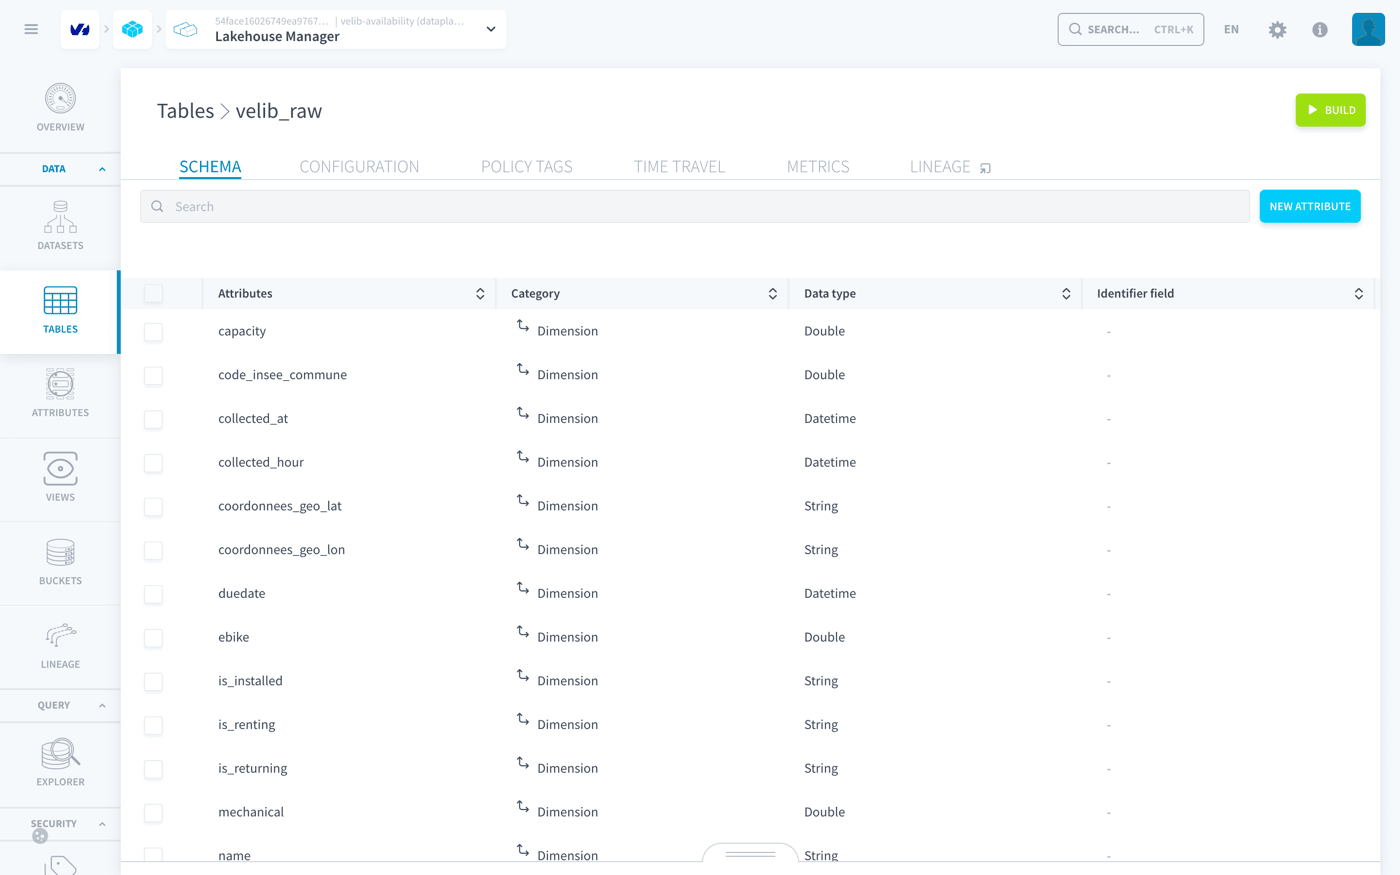
The API does not say when you collected a station. Two columns record it:
-
Open the table
velib_raw, then its Schema tab. -
Click New attribute, name it
collected_at, select the data type Datetime and click Save. Do the same forcollected_hour.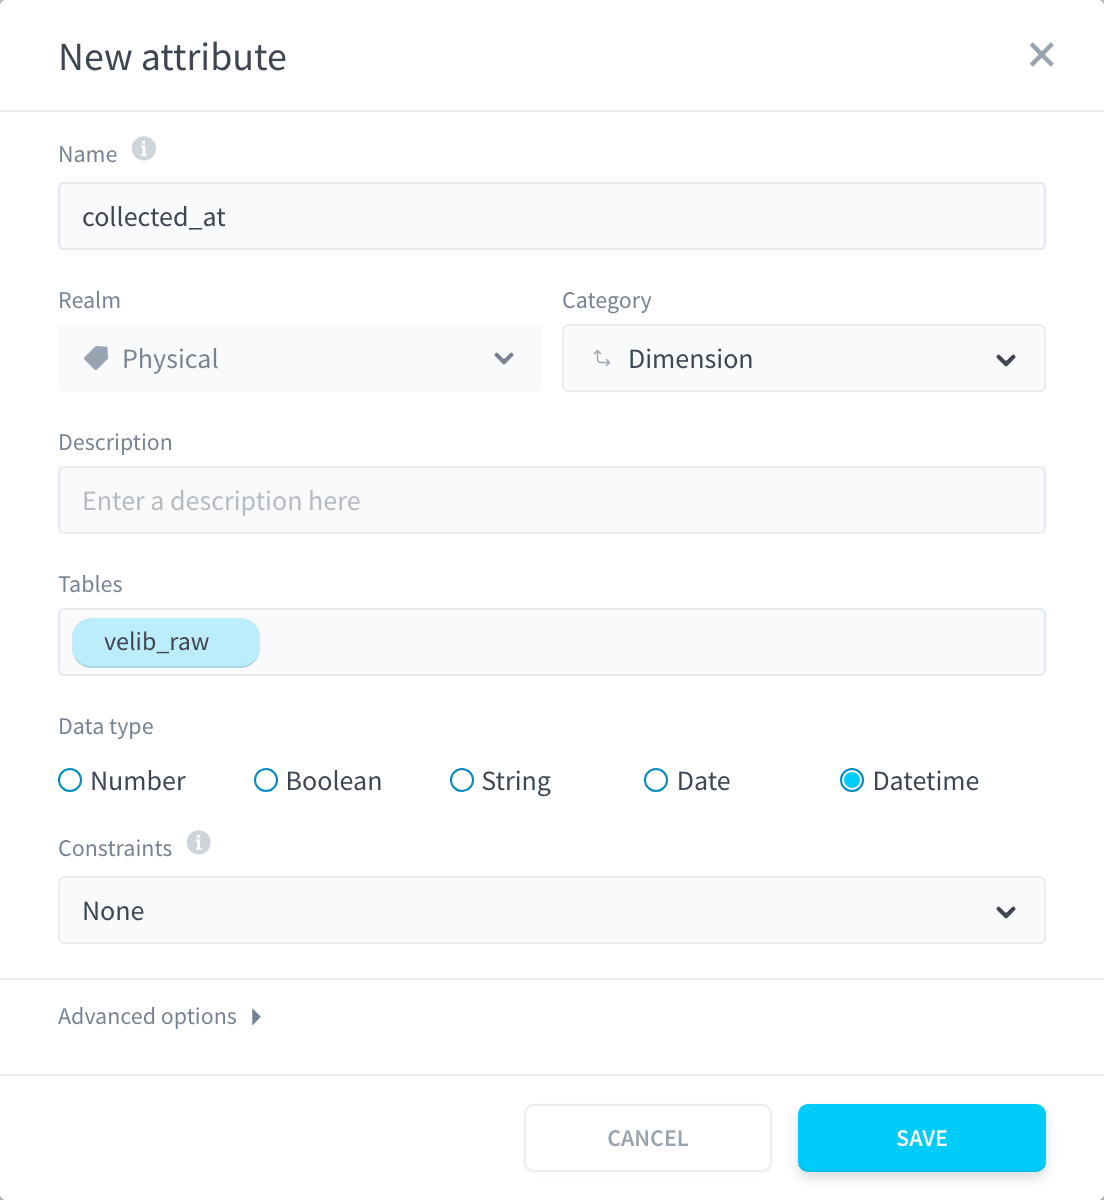
-
Click Build: adding attributes changes the structure of the table.
Emptying the table
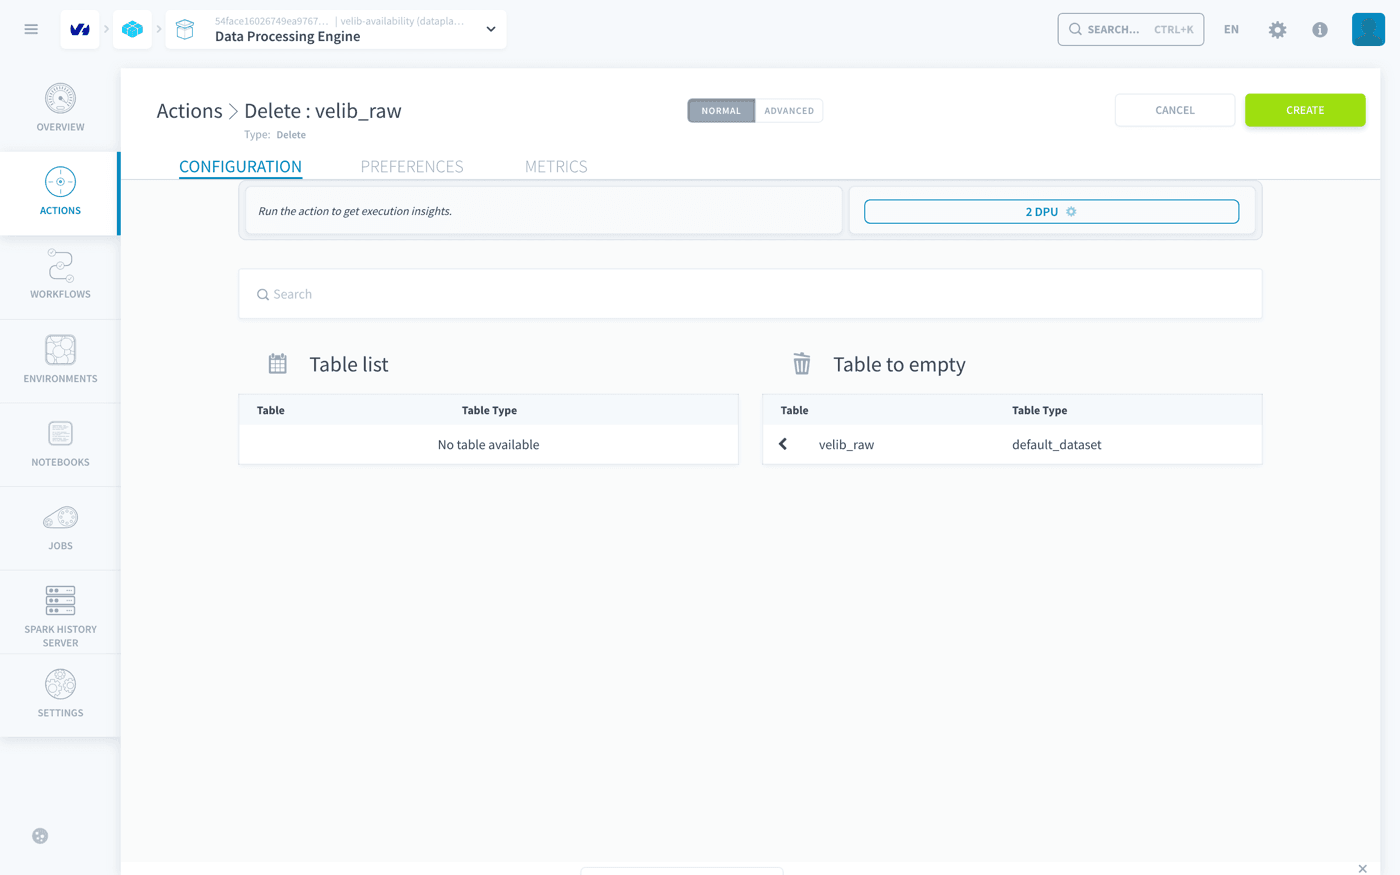
The first load has no collection time. Empty the table with a Delete action before the first real collection:
-
Open Data Processing Engine > Actions, click New action and select the Delete action.
-
In Table list, move
velib_rawto Table to empty. -
Click Create, then run the action.
In the Explorer, SELECT count(*) FROM velib_raw returns 0.
Step 4: Dating each collection
Create an SQL action that dates the rows just loaded.
-
In Data Processing Engine > Actions, click New action and select the SQL action.
-
Name it
Stamp collection time. -
In the Tables panel, click the copy icon of
velib_raw: an SQL action needs the full namecatalog.schema.table, and the catalog name is specific to your project. -
Paste the query below, with that full name in place of
<catalog>.default_dataset.velib_raw: -
Click Validate. Validation is a dry run: it checks the query without changing the table.
-
Click Create.
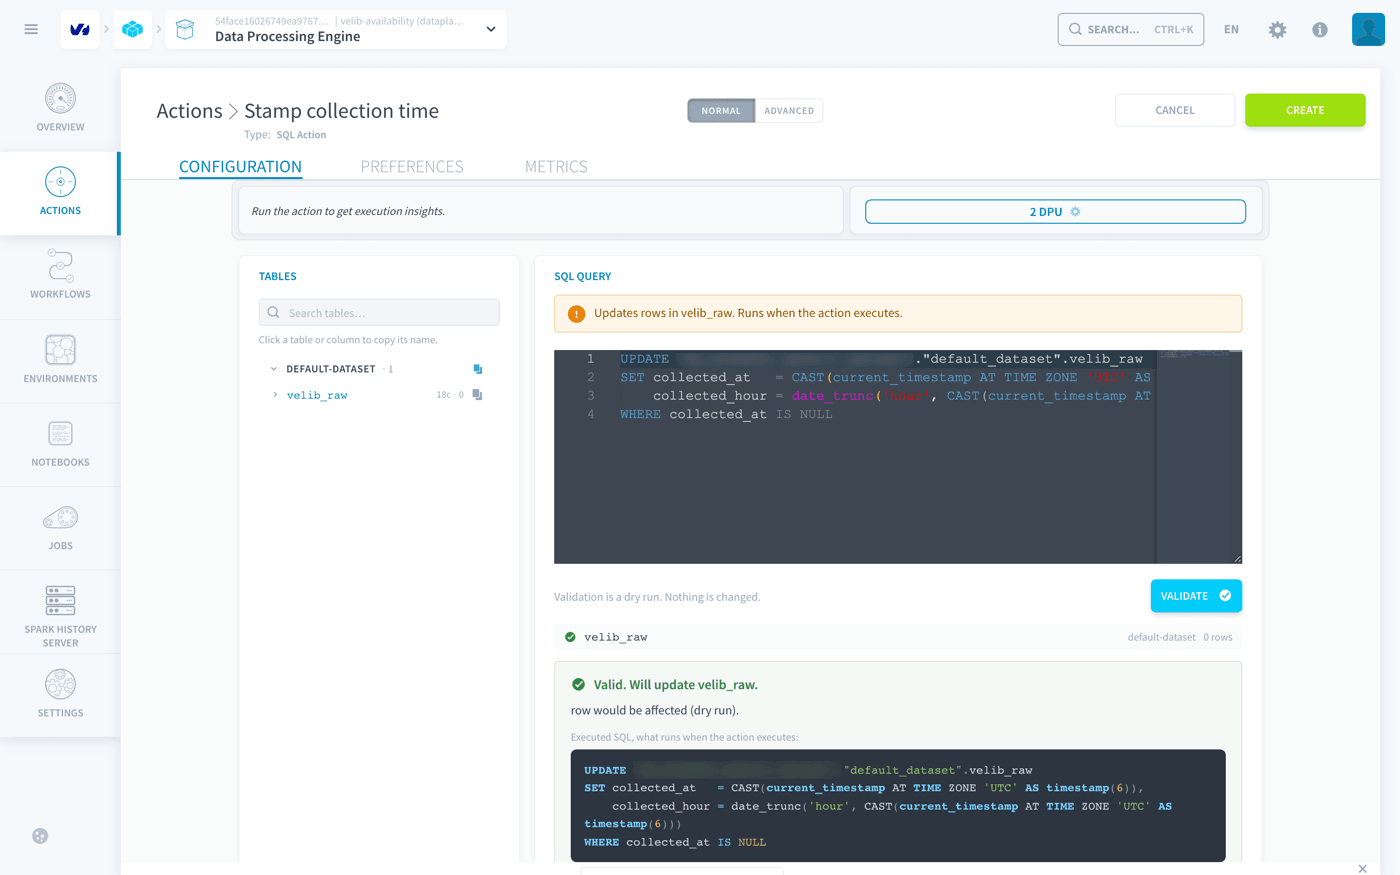
WHERE collected_at IS NULL only dates the rows of the current collection: earlier collections keep their time. Times are stored in UTC, like duedate.
Checking a first collection
-
Run the Load action of
velib_raw, generated when you created the table. -
Run
Stamp collection time. -
In the Explorer, run:
You get one row per station, all stamped, with a single collection time in UTC.
Step 5: Keeping one row per station and hour
When both runs of an hour succeed, each station has two rows for the same hour, possibly with different figures. The Deduplicate action keeps one row per station and hour: the one with the most recent collected_at.
If a run fails between the load and the stamp, the next run loads the stations again, and Stamp collection time dates both loads at once, with the same collected_at. The action still keeps one row per station and hour, but there is no guarantee which of the two it keeps.
-
In Data Processing Engine > Actions, click New action and select the Deduplicate action.
-
Fill in the action:
-
Click Scan: it estimates, without changing anything, how many rows the key would remove. On a single collection, it finds no duplicate.
-
Click Create. The action is named
Deduplicate - velib_raw.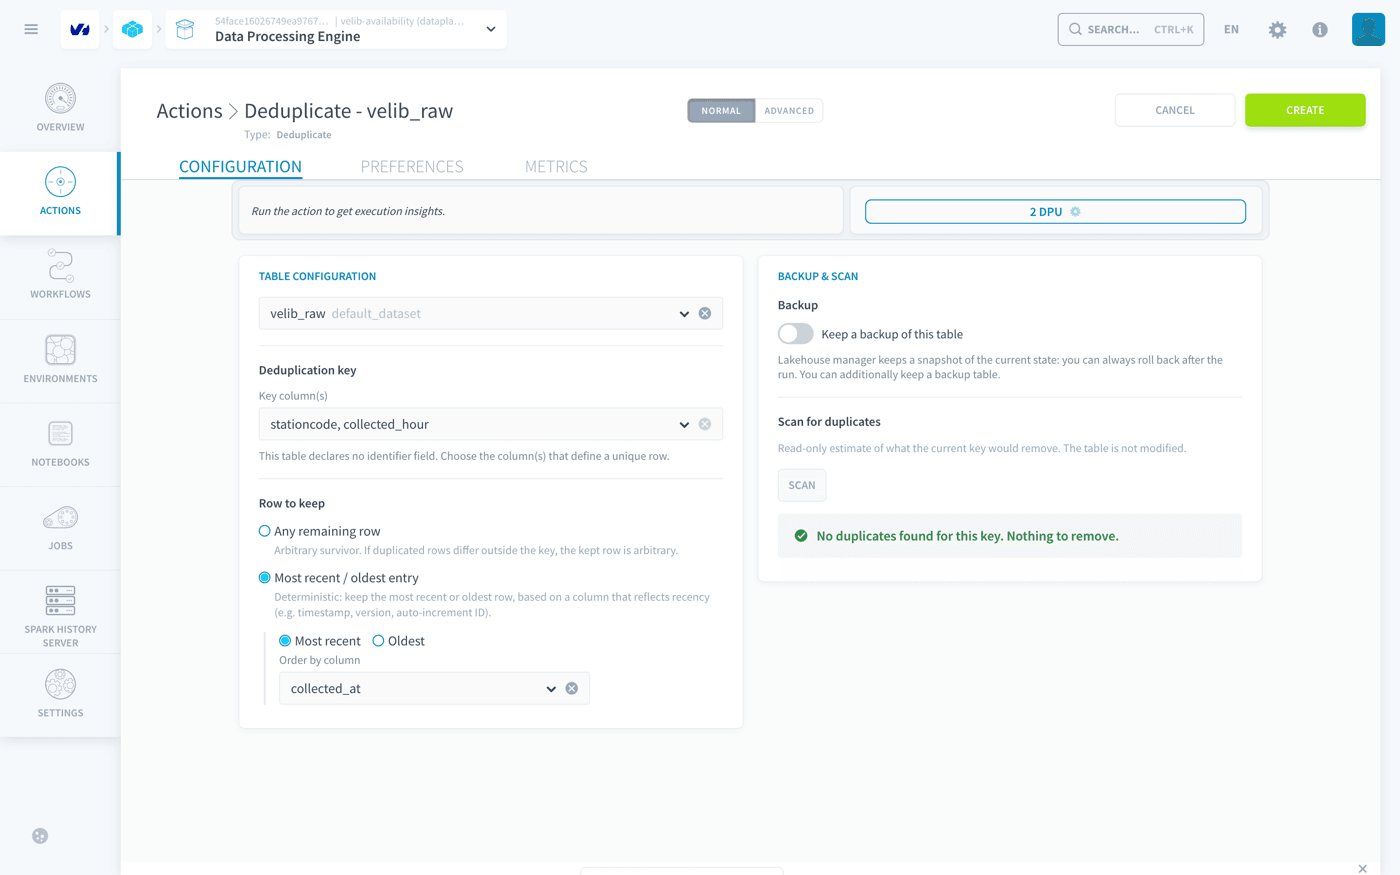
The Deduplicate action reads the whole table at each run, and the table grows by about 36,000 rows a day. Its run time, billed in DPU hours, grows with the history.
Step 6: Scheduling the collection every hour
Creating the workflow
-
Open Data Processing Engine > Workflows and click New workflow.
-
Name it
Vélib collection. -
Add one action per stage, in this order:
-
Click Create.
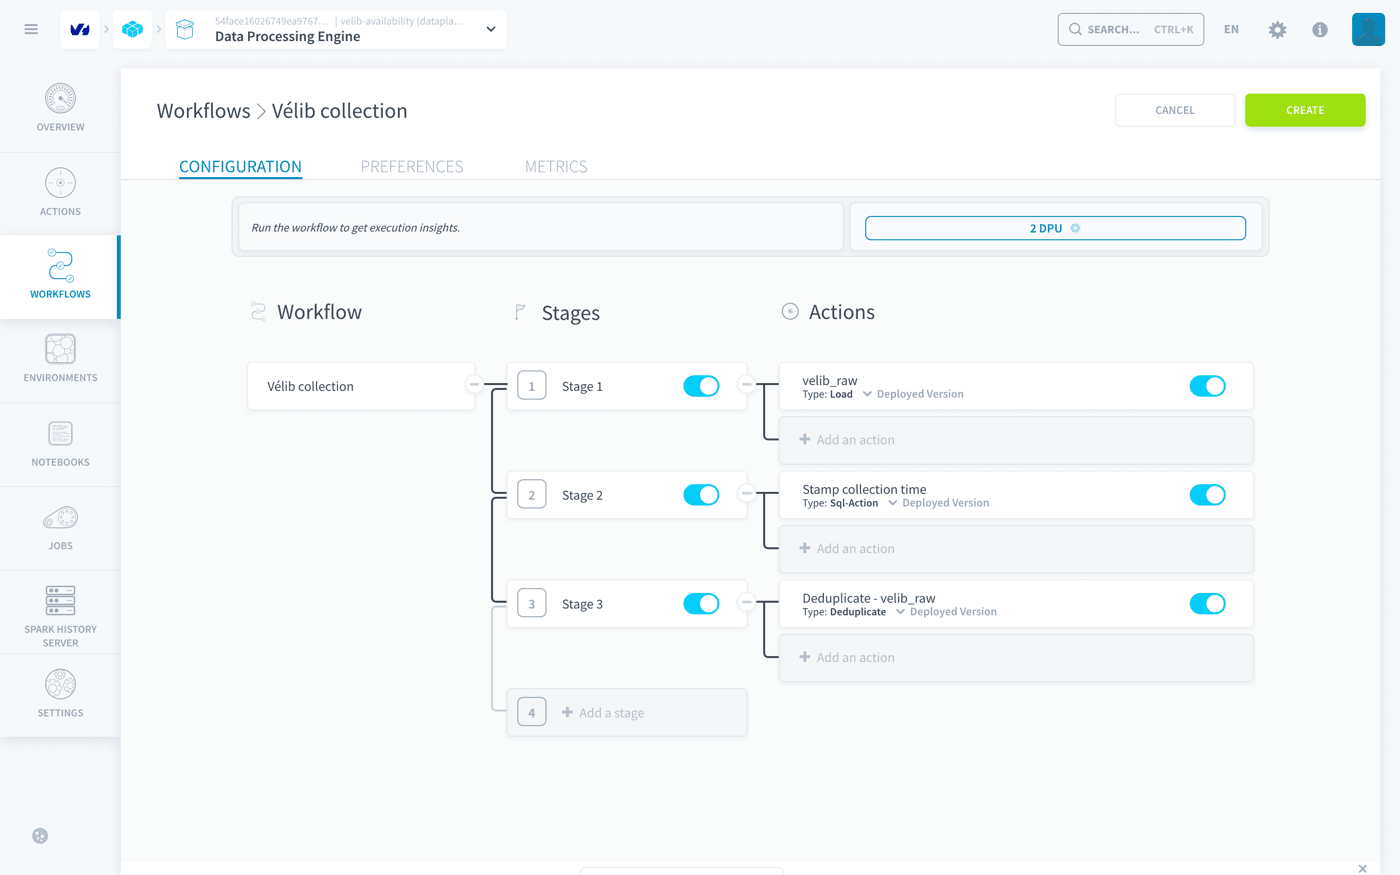
Each action must be in its own stage: actions of the same stage run at the same time, and each step here needs the previous one to be finished.
Scheduling it
In the Preferences tab of the workflow, in the Triggers section, click Add and fill in the time-based trigger:
Click Confirm.
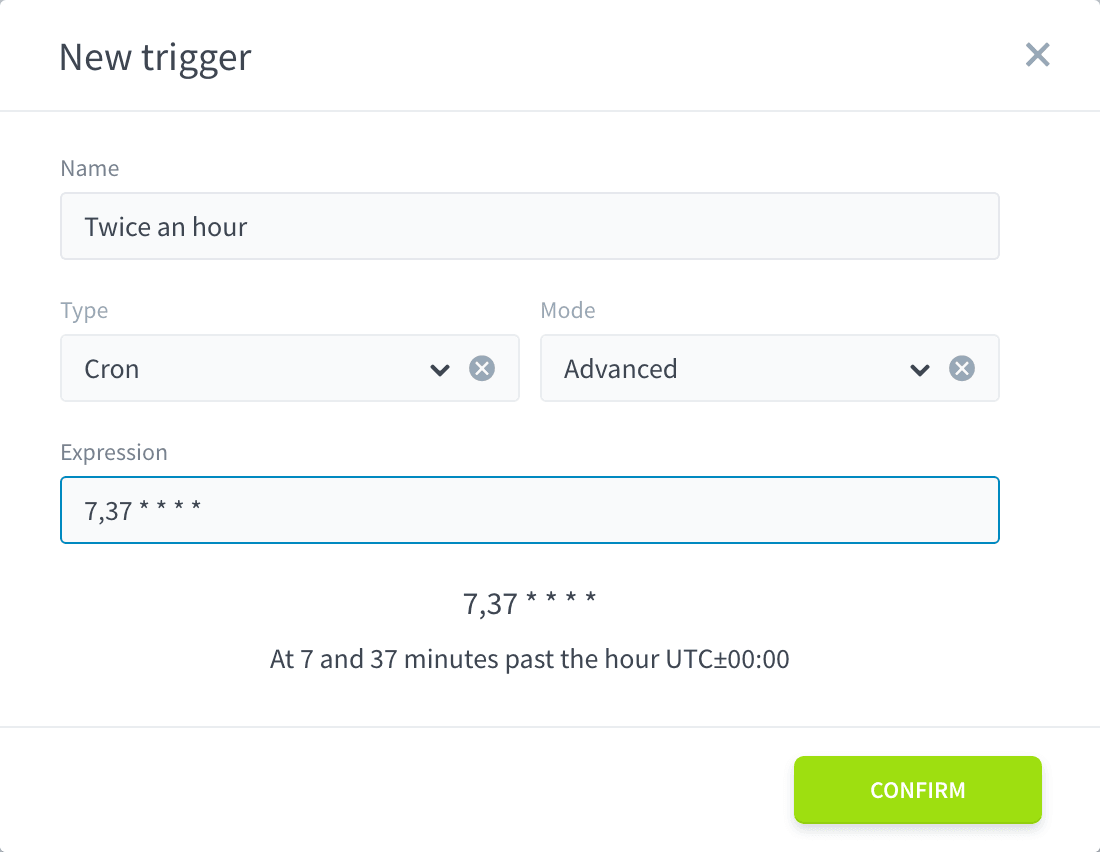
The goal is one collection per hour. The workflow runs twice, at minutes 7 and 37 of every hour, UTC: the second run is a safety net, in case the first one fails. Both runs of an hour get the same collected_hour, and the Deduplicate action keeps the most recent one, so each hour holds one row per station either way. The expression avoids minute 0 on purpose, because many scheduled jobs start at that moment.
Checking the collection
After a few hours, each hour holds exactly one row per station:
Every line shows the same number of stations, about 1,500. A missing hour points to runs that failed; a higher number to a deduplication that did not run. Step 7 gives a query that lists the missing hours.
Step 7: Modelling the data with views
Five views turn the raw history into data ready for analysis. Create each one in Lakehouse Manager > Views > New view, in the dataset default_dataset, in the order below: each view reads the ones before it.
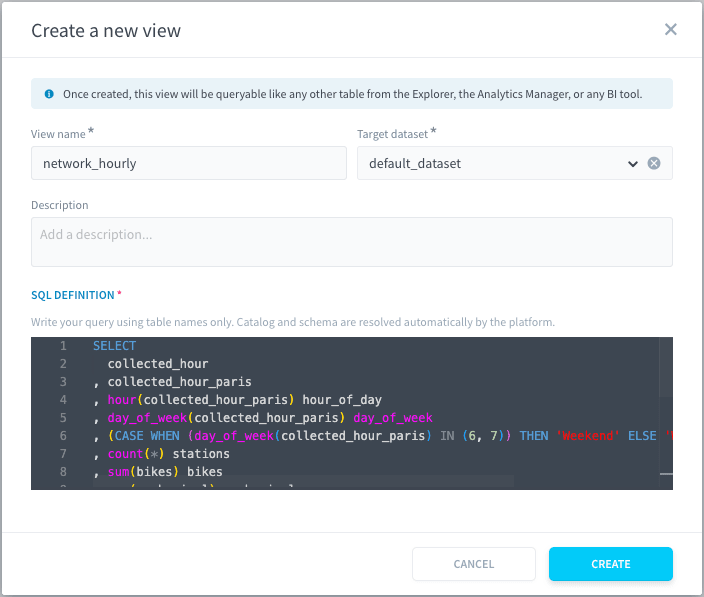
Note: inside a view, a table needs only its name, velib_raw: the catalog and schema are resolved for you. A view read by another view needs its full name, catalog.schema.view. Replace <catalog> with the catalog name of your project, the one you copied in Step 4.
station_hourly
Converts the types, renames the columns and adds the collection hour in Paris time.
capacity - numbikesavailable - numdocksavailable gives the docks that are neither free nor holding a bike: docks out of service.
collected_hour stays in UTC, and every grouping by hour uses it: a UTC hour is never repeated or skipped. collected_hour_paris gives the same hour in Paris time, for display, for the hour of the day and for the day in velib_daily. Do not group hours on it: when the clocks go back in October, two UTC hours share the same Paris time, and when they go forward in March, one Paris hour does not exist. The CAST keeps the Paris time without a time zone, so that Superset handles it as an ordinary date.
network_hourly
Only open stations count: a closed station is neither empty nor full for a user. The hour of the day and the day of the week come from the Paris time, so that 8 a.m. means 8 a.m. in Paris all year round.
station_profile
velib_daily
station_current
Checking the views
In the Explorer, prefix each view with its dataset:
You get the number of stations, about 1,500, and the latest collection hour, in Paris time.
To list the hours with no collection, generate every hour of the period and keep those missing from station_hourly. The query works on the UTC hour, so clock changes create no false gap. Inside a WITH, the view needs its full name:
A run can fail for a transient reason: the second run of each hour fills the gap.
Trino's sequence function returns at most 10,000 entries, that is about 416 days of hourly values: if the history is longer, restrict the period in bounds with a WHERE on collected_hour.
Step 8: Connecting Superset
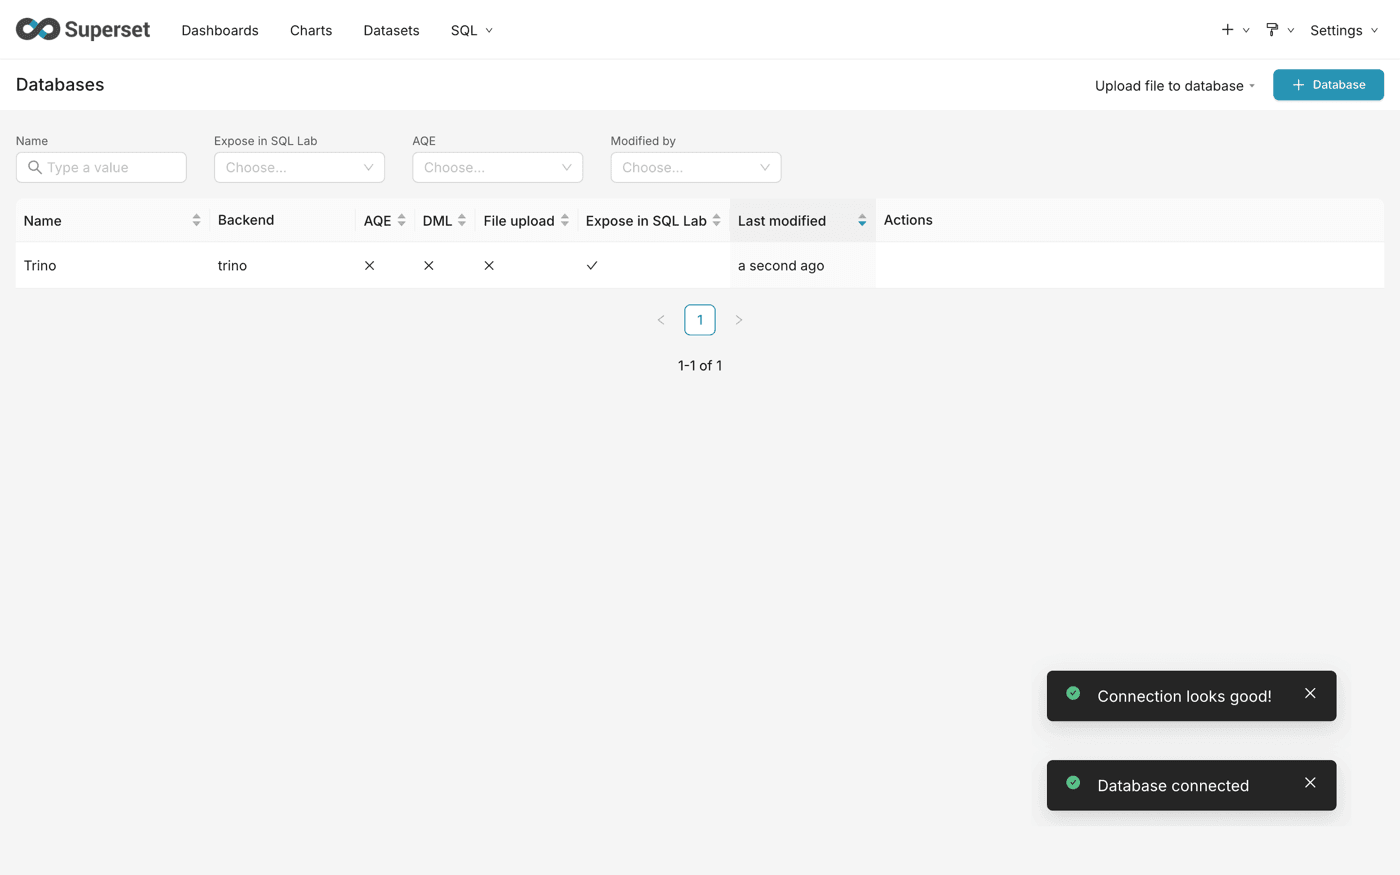
All the data is now ready in the Lakehouse. To analyse it, create an Apache Superset application:
-
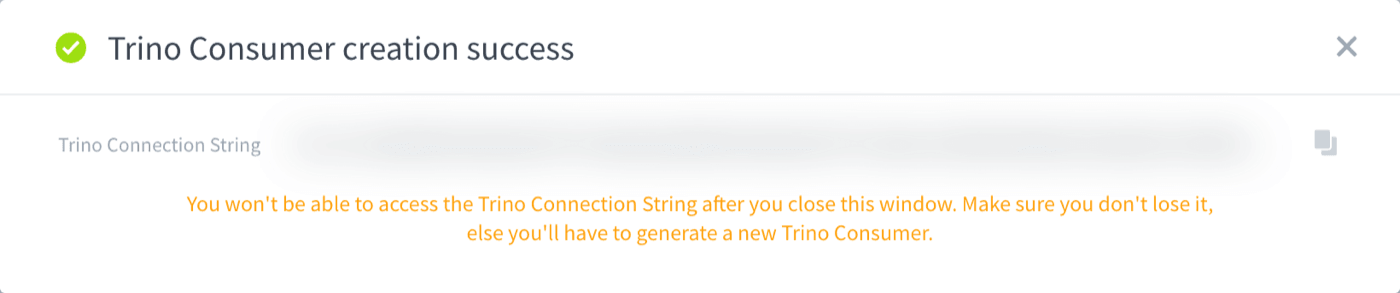
Create a Trino connection by following the Generate a Trino connection string for external tools guide. Copy the connection string before you close the window: it is not shown again.
-
Create the application and connect it to Trino by following Steps 1 to 3 of the Deploying Apache Superset on OVHcloud Data Platform guide.
Creating the datasets in Superset
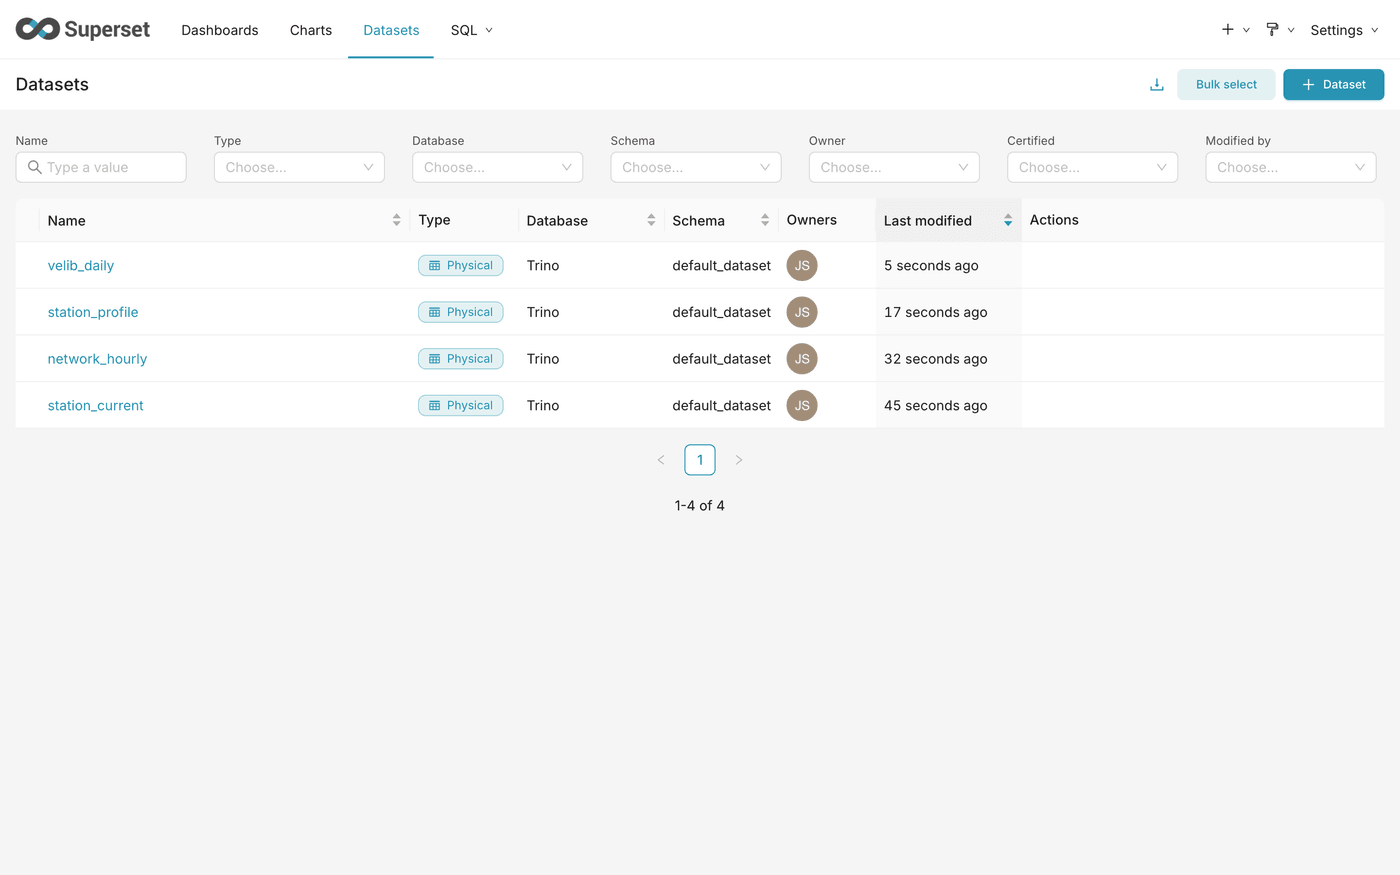
- In Superset, open Datasets and click + Dataset.
- Select the Trino database, then the schema
default_datasetand the viewstation_current. - Click Create and explore dataset.
- Do the same for
network_hourly,station_profileandvelib_daily.
station_hourly only feeds the other views: it does not need a dataset.
Good to know
- The API dates the station, not the change.
duedatecan stay the same while bikes come and go, so it cannot tell two states apart: see the "Why duedate is not the deduplication key" section. - Schedules are in UTC. Paris is one or two hours ahead, depending on the season.
- Load adds rows. Each run of the Load action appends the current state of every station: the history grows without any setting.
Why duedate is not the deduplication key
The obvious key for a history of stations is the station and its update time, stationcode and duedate. It looks right: two collections of a station that did not update return the same duedate.
Time Travel shows it is wrong. On the table as it was before a first deduplication, 676 of the 1,463 duplicated keys had different figures. For example, the station Turbigo - Française had the same duedate in two collections, 06:28:26 UTC, with different figures:
Someone returned an electric bike between the two collections, and duedate did not change. Deduplicating on duedate would have kept one of the two rows at random, and lost a real change. The collection time, which you control, is a key you can trust.
The check that revealed it:
Check that a deduplication key identifies truly identical rows before you trust it: the Scan of the Deduplicate action counts duplicates, but does not say whether they are identical.
What you have built
You have a history of every Vélib' station, collected every hour from a live public API, with a second run as a safety net, cleaned of duplicates and modelled by five SQL views, all without a line of Python. Four Superset datasets sit on top of it.
The next part, Build a Vélib' availability dashboard in Superset, turns these datasets into a dashboard: bikes available now, daily rhythm, problem stations and daily trends.
Go further
For training or technical assistance implementing our solutions, contact your sales representative or visit our Professional Services page to request a quote and have your project analysed by our experts.
Ask questions, give your feedback and interact directly with the team building the Data Platform on the dedicated Discord channel.
If you need support with your OVHcloud services, create a request in our Help Centre.
Join our community of users.