
Collect metrics from Public Cloud instances with Prometheus on an OVHcloud Managed Kubernetes Service
Find out how to collect metrics from VPS, Public Cloud instances or baremetal servers with Prometheus on an OVHcloud Managed Kubernetes Service
Objective
This tutorial show you how to configure the Prometheus operator to monitor static exporter, OVHcloud VPS, OVHcloud dedicated servers or Public Cloud OpenStack instances.
Before you begin
This tutorial presupposes the following:
- That you already have a working Prometheus operator running on an OVHcloud Managed Kubernetes cluster. If you want to know more on those topics, take a look at the Monitoring apps with Prometheus and Grafana on an OVHcloud Managed Kubernetes Service tutorial.
- That you have retrieved the
kubeconfig.ymlfile matching your Kubernetes cluster. - That you have exported the KUBECONFIG environment variable to your
kubeconfig.ymlfile. - That a node exporter agent is listening on the instances you want to monitor on public IP and port 9100.
Important information:
- This node exporter process should be secured, this is not the subject of this tutorial.
Important information:
- Use at least the version
0.75.1of the Prometheus operator prometheus-community/kube-prometheus-stack. You can use the option--set prometheusOperator.image.tag="v0.75.1"when installing the chart to set it.
This tutorial uses as an example a node-exporter to scrape but it can be adapted to any exporter, by adjusting the IP and listening port.
In the next step, you need the release name of your chart. To get it, just use the following command:
Here the release name is kube-prometheus-stack-1720169205, referenced in the next steps under the form <release_name>.
Instructions
Generate the configuration for static exporter
Let's assume you want to scrape the following exporter prometheus.demo.do.prometheus.io:9090.
Create a file named static.yaml with the following content:
Apply this custom resource (CR) using the following command:
It could take a couple of minutes before reloading the Prometheus configuration automatically.
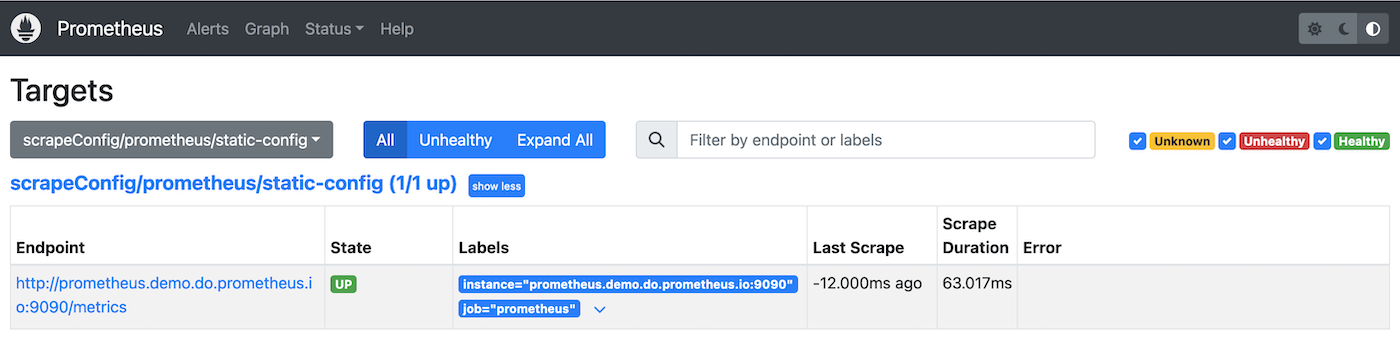
After a few minutes, by checking the Prometheus targets HTTP interface, you should be able to observe something like this inside the Prometheus User Interface (UI):
Generate the configuration for OpenStack
Create a dedicated user inside your Public Cloud project with the Infrastructure Supervisor role:
- Log in to the , go to the Public Cloud section, and select your project.
- In the left sidebar, click Users & Roles.
- Click Add user, fill in a username and optional description, then click Confirm.
- Once the user is created, click the ... button next to it and select Edit roles.
- Enable the Infrastructure Supervisor role and save.
Create a file openstack_user_password.yaml with the following content:
Apply this secret to your Prometheus namespace inside your Kubernetes cluster with the following command:
Retrieve your OpenStack user info from the command-line tool (refer to the Setting OpenStack environment variables guide) for the region you want to scrape.
This example uses the GRA11 region.
To download the OpenRC file, go to Users & Roles in your Public Cloud project, click the ... button next to the user, and select Download OpenStack RC file. In the dialog, choose the region you want to scrape (this example uses GRA11) and confirm the download.
The id is used as userid in the openstack_sd_config.
Create a file named openstack.yaml with the following content:
For more information, refer to the official Prometheus documentation.
Apply this CR using the following command:
It could take a couple of minutes before reloading the Prometheus configuration automatically.
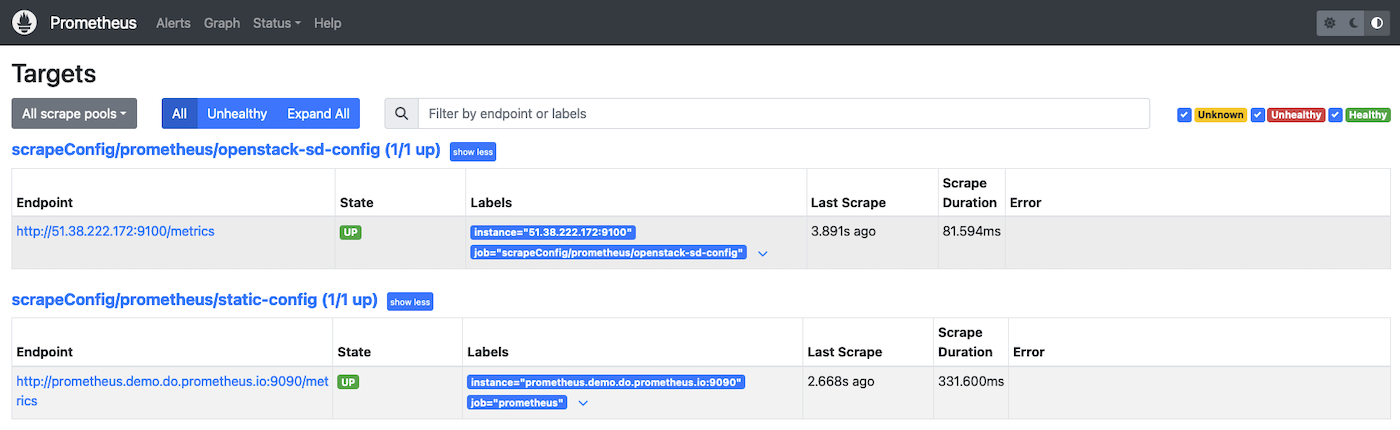
After a few minutes, by checking the Prometheus targets HTTP interface, you should be able to observe something like this inside the Prometheus UI:
Generate the configuration for OVHcloud VPS
Create dedicated script credentials (as described here). Follow our First steps with the OVHcloud APIs tutorial to generate them via the , then note the application key, application secret, and consumer key — you will need them in the next step.
Important information:
This subject is not covered in this tutorial but you should restrict the API routes the token has access to.
Create a file named ovhcloud_api_credentials.yaml containing your API secrets:
Apply this secret to your Prometheus namespace inside your Kubernetes cluster with the following command:
Create a file named ovhcloud.yaml with the following content:
For more information, please refer to the official Prometheus documentation.
Apply this CR using the following command:
It could take a couple of minutes before reloading the Prometheus configuration automatically.
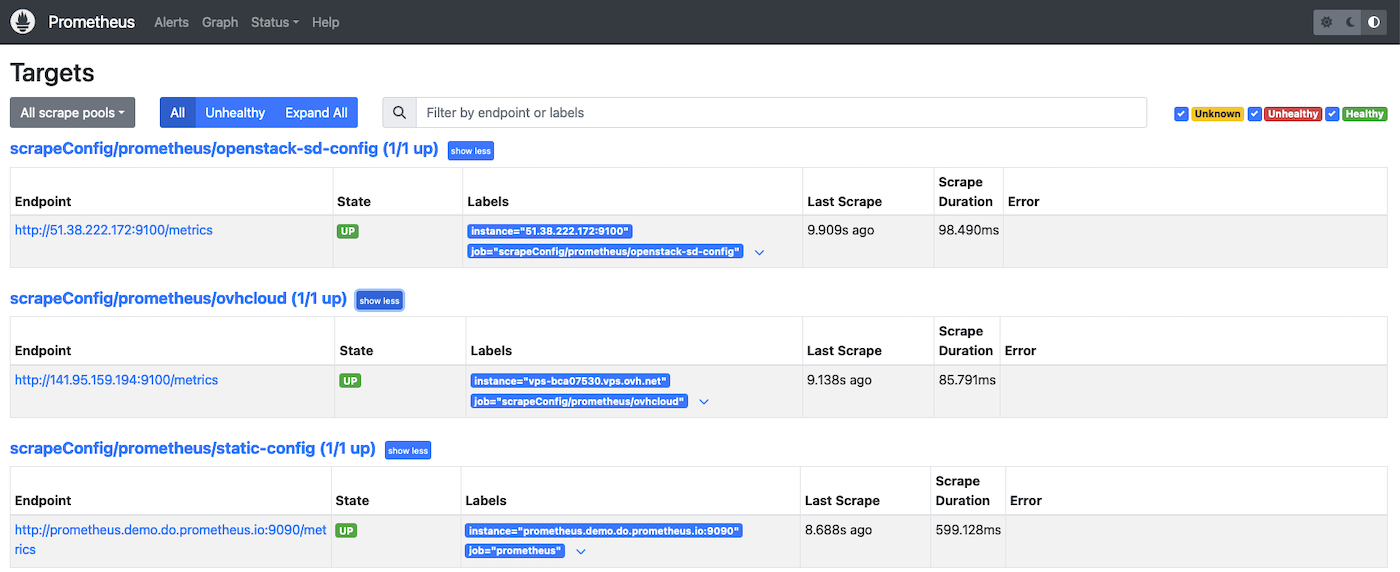
After a few minutes, by checking the Prometheus targets HTTP interface, you should be able to observe something like this inside the Prometheus UI:
Go further
For more information, please read the following links
- Scrape configuration Custom Resource documentation
- Prometheus operator ScrapeConfig API Reference
- Prometheus operator StaticConfig API Reference
- Prometheus operator OpenStackSDConfig API Reference
- Prometheus operator OVHCloudSDConfig API Reference
For training or technical assistance implementing our solutions, contact your sales representative or visit our Professional Services page to request a quote and have your project analysed by our experts.
Join our community of users.