
AI Notebooks - Tutorial - Weights & Biases integration
How to use wandb in notebooks
Objective
The purpose of this tutorial is to show how it is possible to use Weights & Biases, one of the most famous Developer tools for machine learning, with OVHcloud AI Notebooks.
Weight and Biases allow you to track your machine learning experiments, version your datasets and manage your models easily, like shown below :
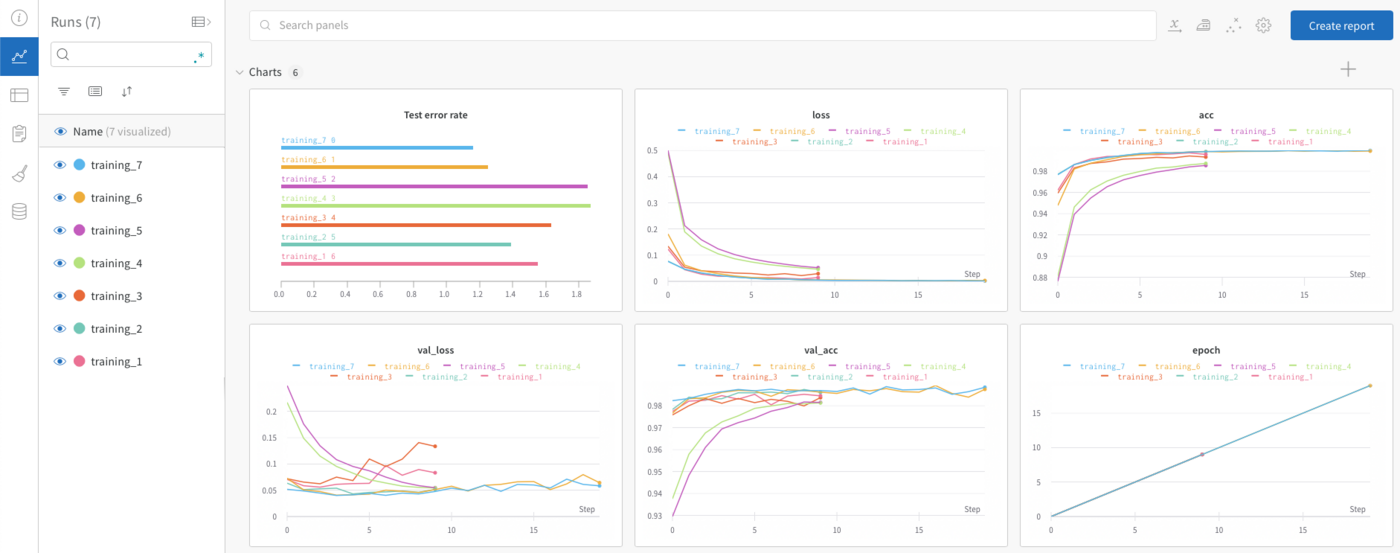
This tutorial presents two examples of using Weights & Biases. In the first notebook we will use TensorFlow and in the second a PyTorch docker image.
Requirements
- access to the ;
- a Public Cloud project created;
- a Public Cloud user with the ability to start AI Notebooks;
- a Weights & Biases account, you can create it on their website. It's Free for individuals.
Instructions
Launch and access a Jupyter notebook
The first step consists of creating a Jupyter Notebook with OVHcloud AI Notebooks.
First, you have to install the OVHAI CLI then just choose the name of the notebook (<notebook-name>) and the number of GPUs (<nb-gpus>) to use on your job and use the following command:
- TensorFlow image docker:
- PyTorch image docker:
Whatever the selected method, you should now be able to reach your notebook's URL (see in the output of the command, the field Url:).
Experiment with OVHcloud examples notebooks
Once the repository has been cloned, find the notebook of your choice.
Instructions are directly shown inside the notebooks. You can run them with the standard "Play" button inside the notebook interface.
Notebook using TensorFlow and Weights & Biases is based on the MNIST dataset
The notebook using TensorFlow and Weights & Biases is based on the MNIST dataset. To access it, follow this path:
ai-training-examples > notebooks > computer-vision > image-classification > tensorflow > weights-and-biases > notebook_Weights_and_Biases_MNIST.ipynb
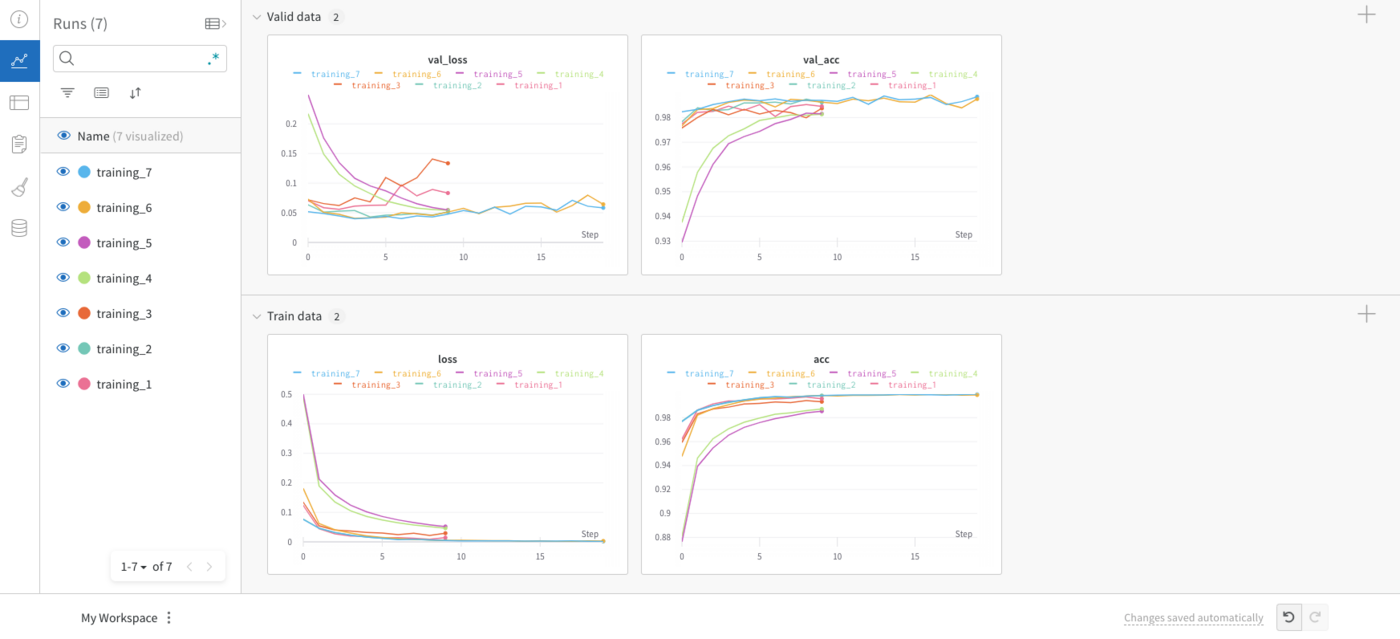
The aim of this tutorial is to show how it is possible, thanks to Weights & Biases, to compare the results of trainings according to the chosen hyperparameters.
For example, you can display the accuracy and loss curves for your valid and train data. These metrics will be displayed for each epoch of each training.
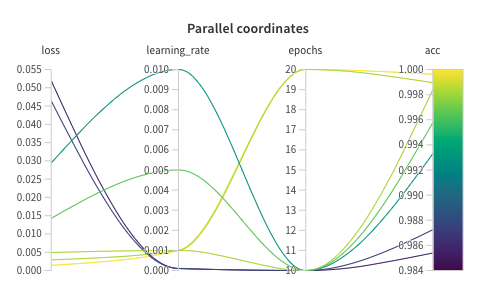
You can then compare your trainings using the Parallel coordinates graph type:
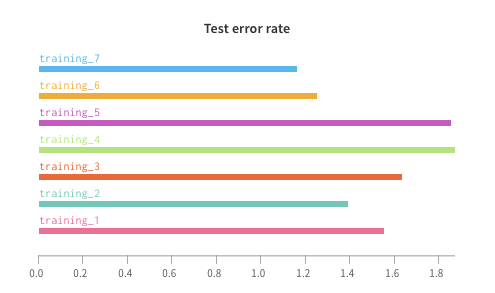
You can also compare the Test error rates:
A preview of this notebook can be found on GitHub.
Notebook using PyTorch and Weights & Biases is based on YOLOv5 and the COCO dataset
The notebook using PyTorch and Weights & Biases is based on YOLOv5 and the COCO dataset. To access it, follow this path:
ai-training-examples > notebooks > computer-vision > object-detection > miniconda > weights-and-biases > notebook_Weights_and_Biases_yolov5.ipynb
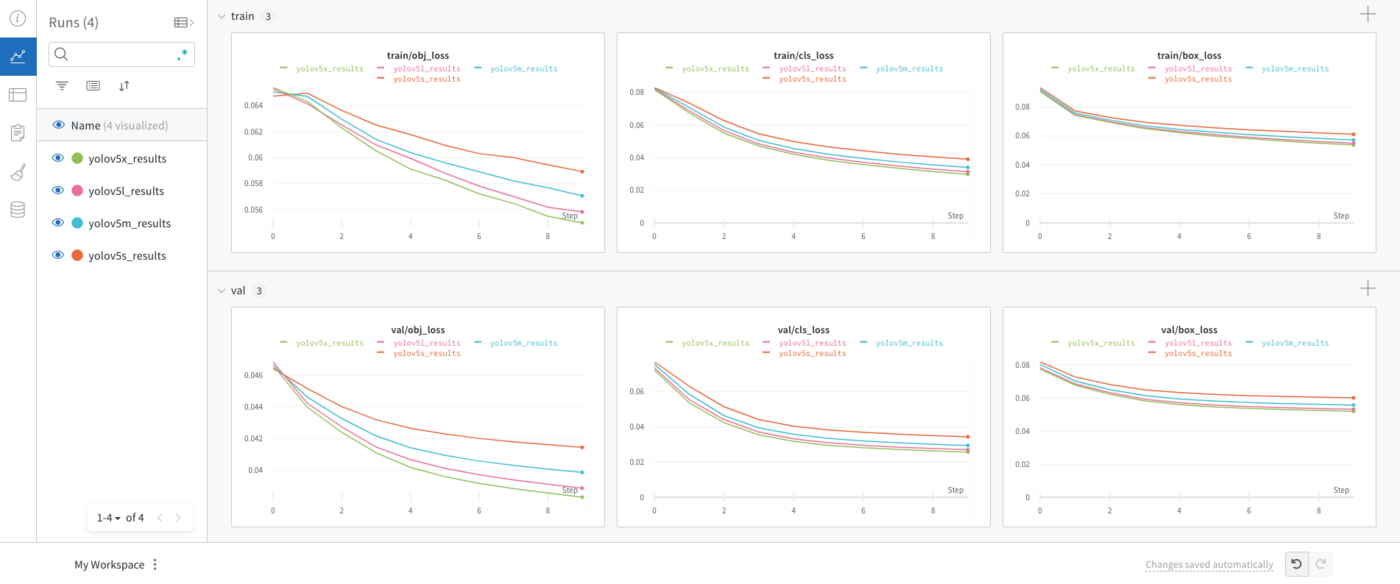
The aim of this tutorial is to show how Weights & Biases can be used with the YOLOv5 real-time object detection framework. In order to achieve this, the YOLOv5 s, m, l and x models performance will be compared on the COCO dataset for the same number of epochs.
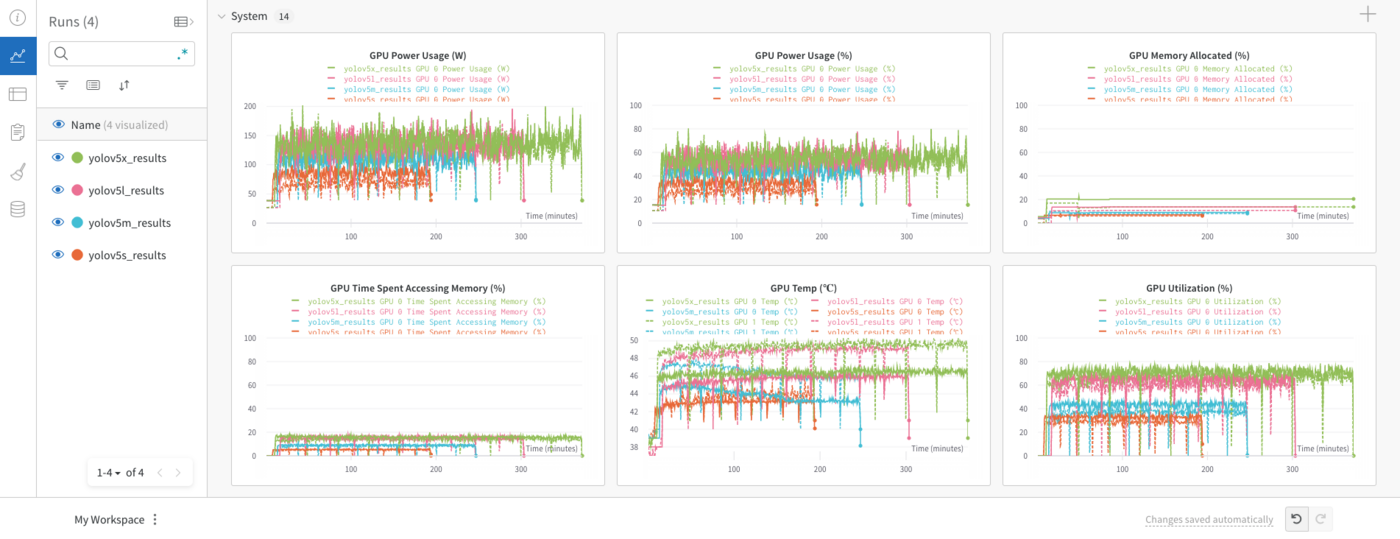
Another possibility with Weights & Biases is to display the use of your computing resources:
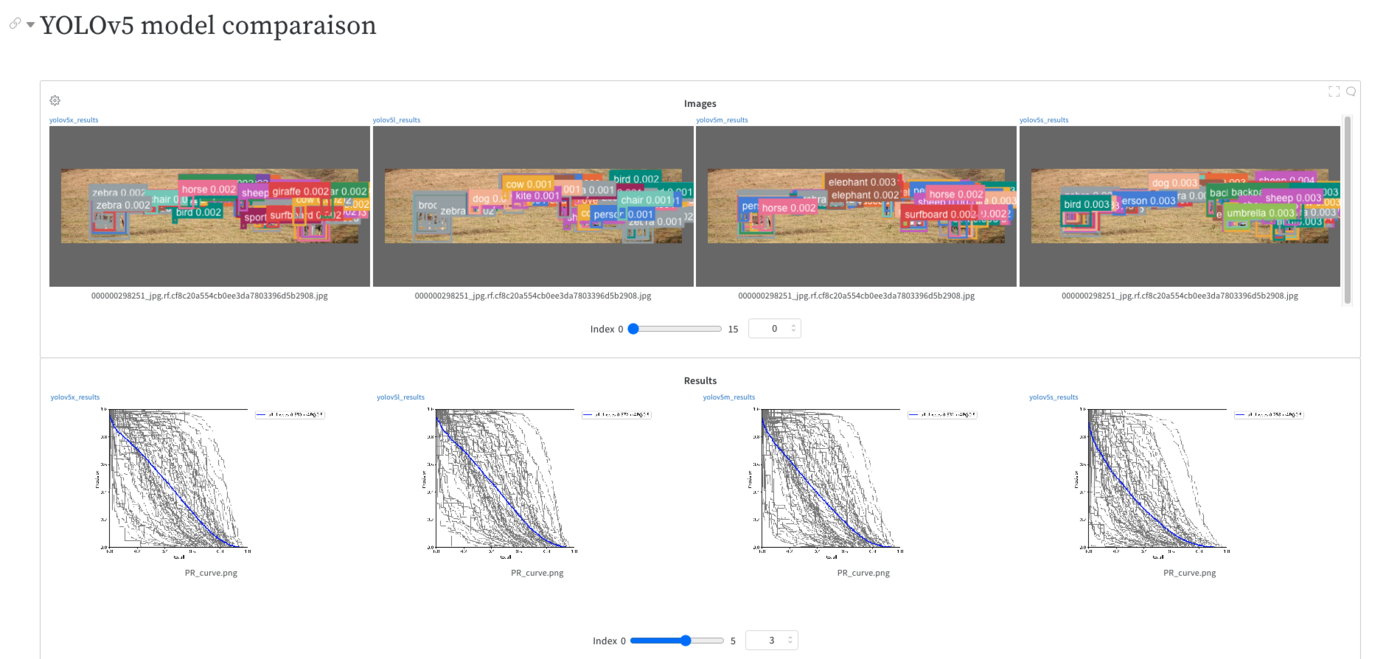
You can also create your report with your curves and images and share it with your team!
A preview of this notebook can be found on GitHub.
Conclusion
To sum up, Weights & Biases allows you to quickly track your experiments, version and iterate data sets, evaluate model performance, reproduce models, visualise results and spot regressions, and share results with your colleagues.
You can use it directly on OVHcloud AI Notebooks in few minutes.
Go further
- You can also use the Weights & Biases tool in an AI Training job by following this tutorial.
- It is possible to integrate Weights and Biases to compare the performance of pre-trained models like ResNet50 for image classification. Take a look at this notebook.
For training or technical assistance implementing our solutions, contact your sales representative or visit our Professional Services page to request a quote and have your project analysed by our experts.
Feedback
Please send us your questions, feedback and suggestions to improve the service:
- On the OVHcloud Discord server