---
title: "How to initiate a diagnostic for OVHcloud Connect from the OVHcloud Control Panel"
description: "Find out how to get a status report of your OVHcloud Connect services"
url: https://docs.ovhcloud.com/pt/guides/network/ovhcloud-connect/occ-diagnostics
lang: pt
lastUpdated: 2025-04-28
---
# How to initiate a diagnostic for OVHcloud Connect from the OVHcloud Control Panel
## Objective
With OVHcloud Connect, you can link your company network to your private OVHcloud vRack network, without creating a VPN tunnel through the internet. This will give you a quicker, more stable connection with guaranteed bandwidth.
**This guide will show you how to get a status report of your OVHcloud Connect services via the OVHcloud Control Panel.**
## Requirements
- An [OVHcloud Connect solution](https://www.ovhcloud.com/pt/network/ovhcloud-connect/) with a valid POP configuration.
- Access to the OVHcloud Control Panel.
## List of available diagnostics
### Layer 3 mode
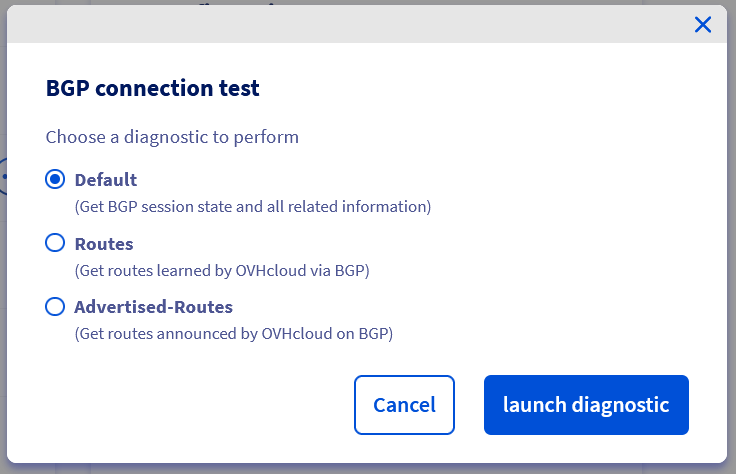
- **Default**: Fetches the BGP session states and all related information.
- **Routes**: Fetches the routing table learned by OVHcloud via BGP.
- **Advertised-Routes**: Fetches the routing table advertised by OVHcloud via BGP.
### Layer 2 mode
- **MAC Address**: Fetches the list of MAC addresses of network devices and vRack.
## Instructions
### Layer 3 mode
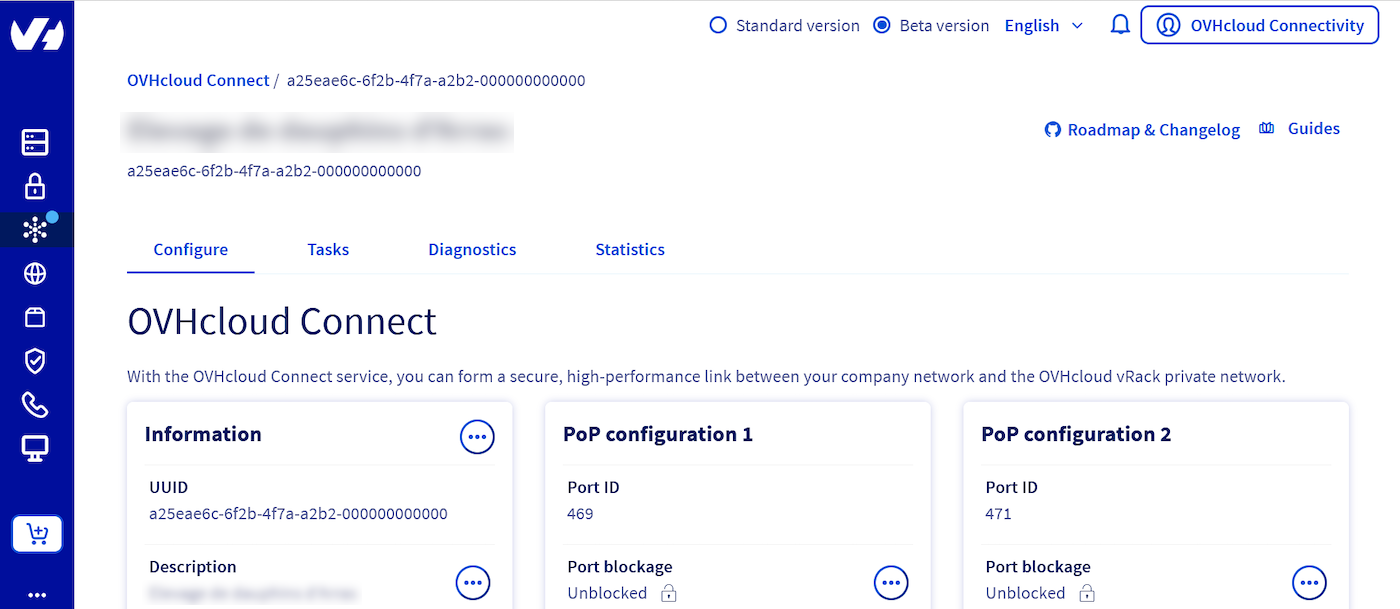
You can find the list of your `OVHcloud Connect
` services in the `Network
` section of your OVHcloud Control Panel
.
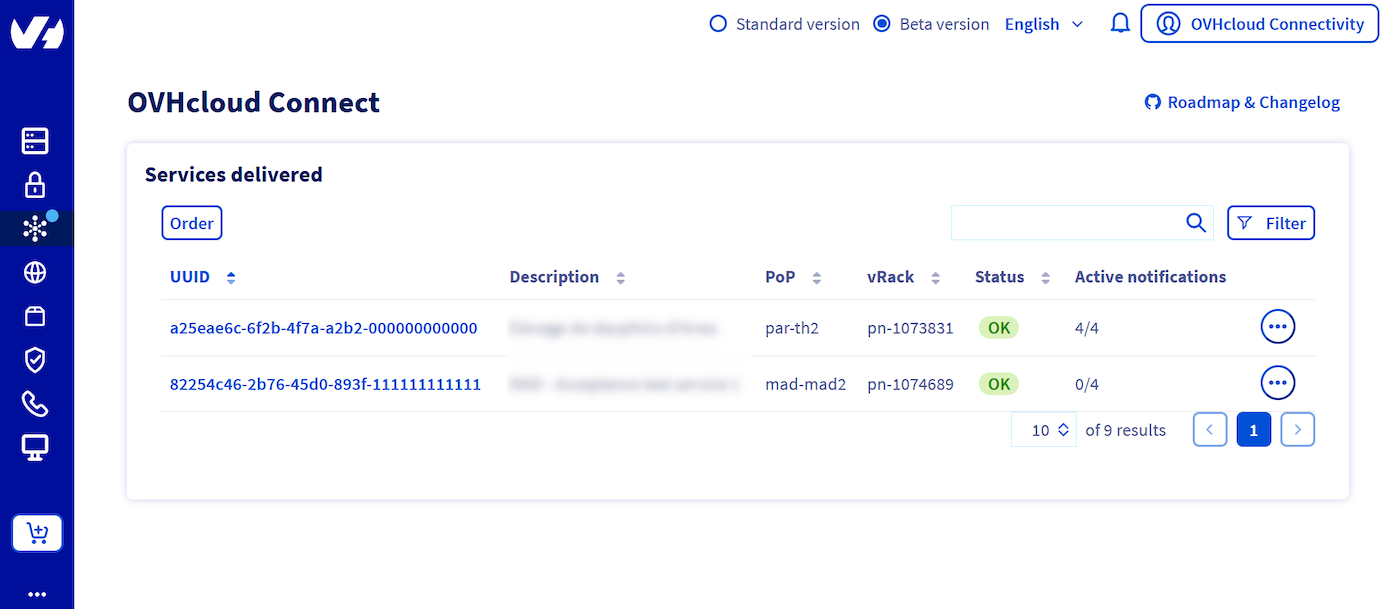
Open the service for which you want to get a diagnosis:
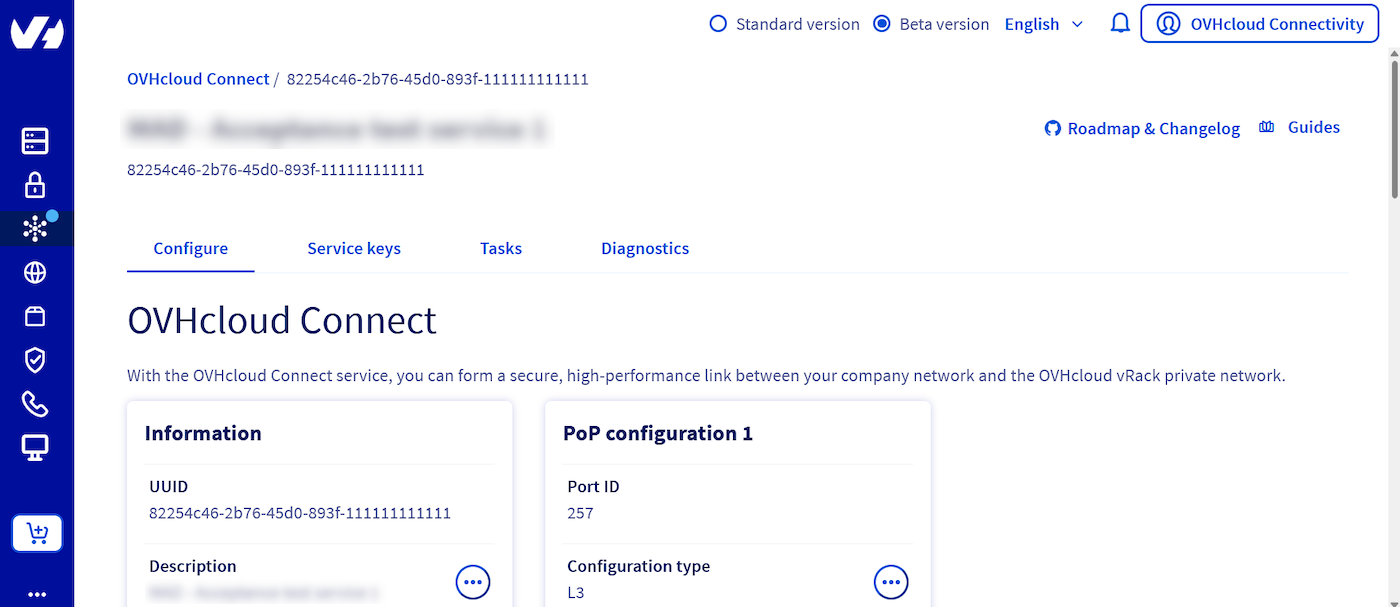
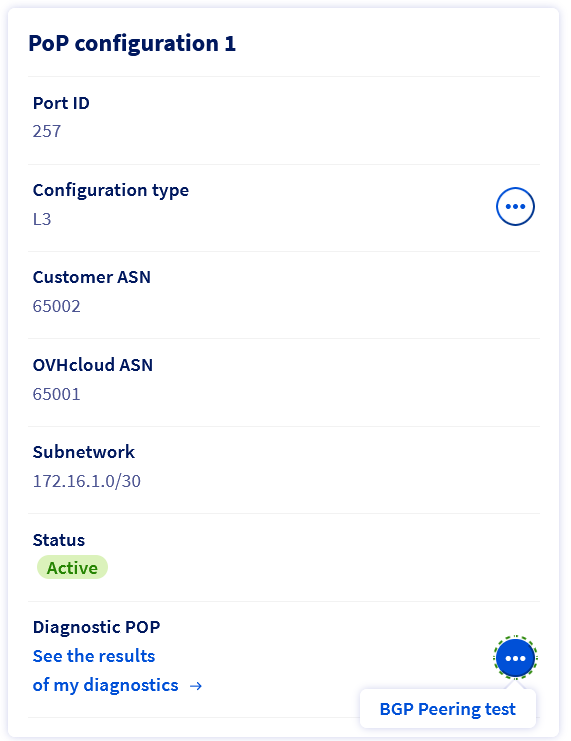
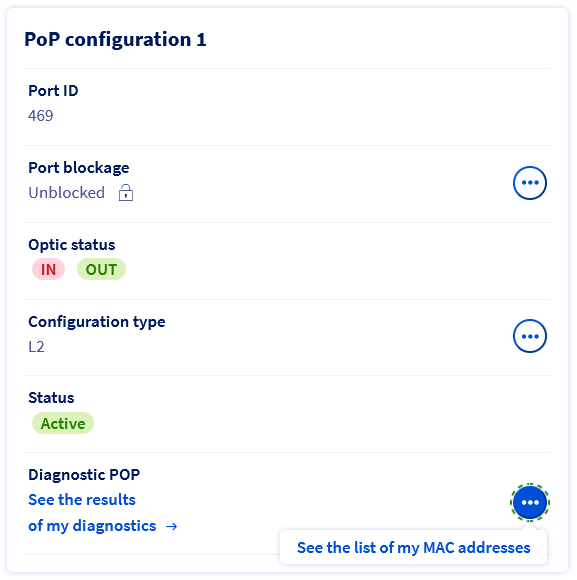
At the bottom of the "POP Configuration" panel, you will find a segment named "Diagnostic POP", and an ellipsis button `...
`. Click it, and then select "BGP Peering Test":
A window will open. Select the type of diagnostics you wish to use, and click "launch diagnostic":
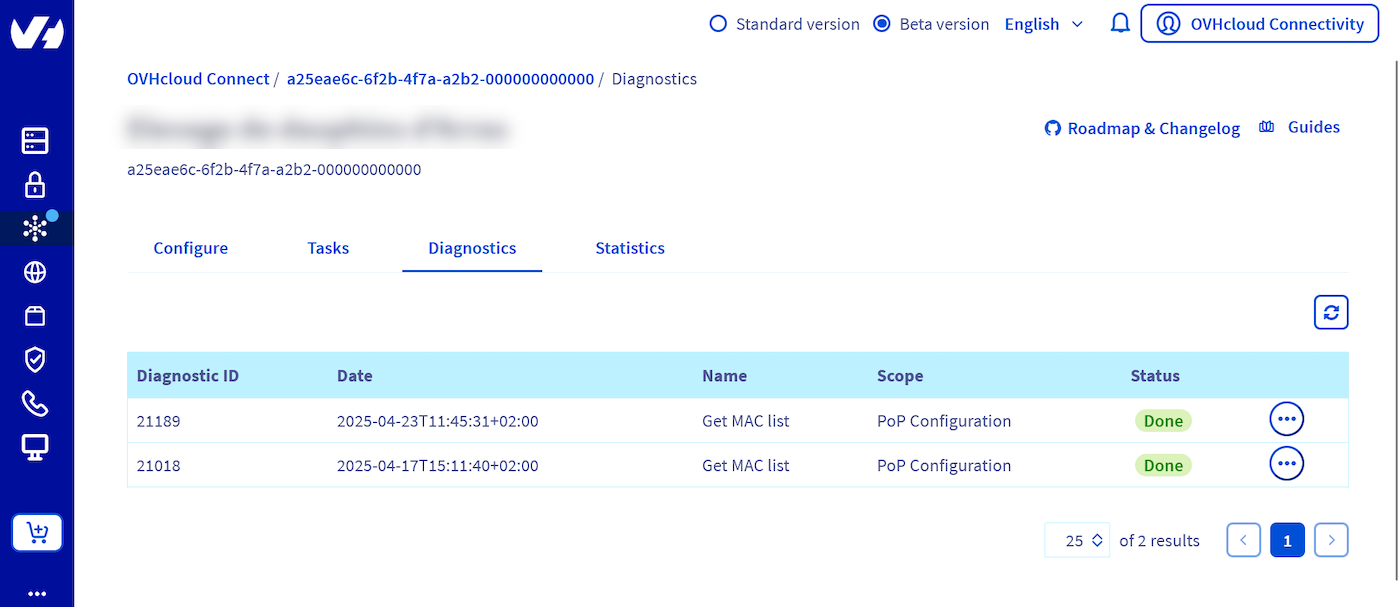
You can now access the list of your diagnostics by opening the "Diagnostics" tab.
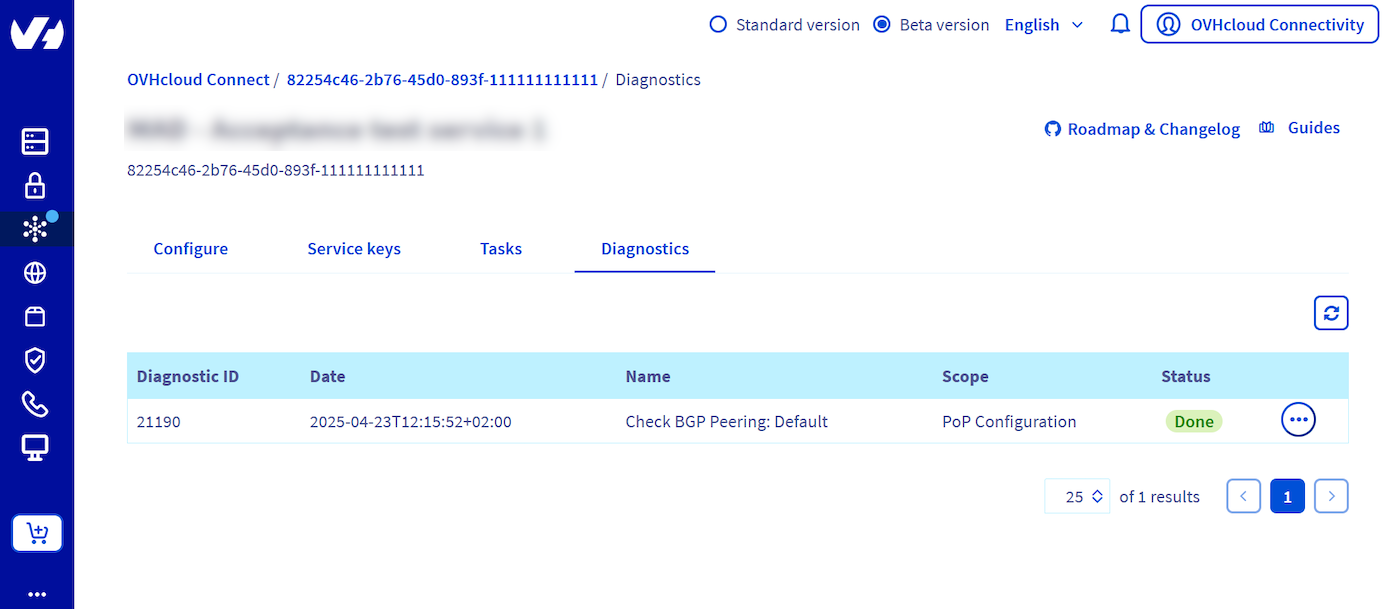
Each diagnostic is referred to using an ID and a timestamp.
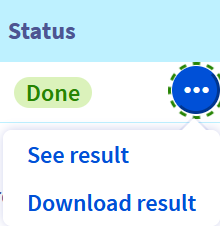
To access the diagnostics content, click the ellipsis button `...
` located to the right of each one listed. You can select either "See result" to have a window open with the content of the desired diagnostic, or "Download result" to get a _.txt_
file with the same content.
### Layer 2 mode
You can find the list of your `OVHcloud Connect
` services in the `Network
` section of your OVHcloud Control Panel
.

Open the service for which you want to get a diagnosis:
At the bottom of the "POP Configuration" panel, you will find a segment named "Diagnostic POP", and an ellipsis button `...
`. Click it, and then select "Get the list of my MAC addresses":
You can now access the list of your diagnostics by opening the "Diagnostics" tab.
Each diagnostic is referred to using an ID and a timestamp.
To access the diagnostics content, click the ellipsis button `...
` located to the right of each one listed. You can select either "See result" to have a window open with the content of the desired diagnostic, or "Download result" to get a _.txt_
file with the same content.

## Limits
- **Retention time of diagnostics**: Only diagnostics initiated **within the last seven days** are accessible. We recommend you download them and properly archive them, in case you need future access.
- **Maximum number of diagnostics**: On a 24 hour period, you can initiate a maximum of 10 diagnostics per type of diagnostic, and per service. For example, if you have two OVHcloud Connect services configured on your OVHcloud Control Panel, both configured in Layer 3 mode, you can theoretically launch 10 of each diagnostic type per service, for a total of 60.
This limit has been set in order to restrict the amount of resources used by the OVHcloud infrastructures, as the diagnostics are launched in real-time.
## Go further
If you need training or technical assistance to implement our solutions, contact your sales representative or click on [this link](https://www.ovhcloud.com/pt/professional-services/) to get a quote and ask our Professional Services experts for assisting you on your specific use case of your project.
Join our [community of users](https://community.ovhcloud.com/community/en).