---
title: "Alerting - Using ElastAlert 2 with Logs Data Platform"
description: "Deploy in a few minutes one of the most complete alert system."
url: https://docs.ovhcloud.com/es/guides/manage-and-operate/observability/logs-data-platform/elastalert
lang: es
lastUpdated: 2024-08-07
---
# Alerting - Using ElastAlert 2 with Logs Data Platform
## Objective
[ElastAlert 2](https://github.com/jertel/elastalert) is an alerting framework originally designed by Yelp. It is able to detect anomalies, spikes, or other patterns of interest. It is production-ready and is a well known standard of alerting in the Elasticsearch/OpenSearch ecosystem. Their motto is: "If you can see it in your dashboards, ElastAlert 2 can alert on it." In this document you will learn how to deploy this component on Logs Data Platform thanks to its compatibility with OpenSearch through [aliases](/es/guides/manage-and-operate/observability/logs-data-platform/opensearch-dashboards.md) and [indexes](/es/guides/manage-and-operate/observability/logs-data-platform/ldp-index.md). Logs Data Platform also allows you to host ElastAlert meta-indices on Logs Data Platform.
## Requirements
Note that in order to complete this tutorial, you should have at least:
- [Activated your Logs Data Platform account.](https://www.ovh.co.uk/order/express/#/new/express/resume?products=~%28~%28planCode~%27logs-account~productId~%27logs%29)
- A machine on which you will deploy ElastAlert.
- Some data on an alias or an index.
***
### OVHcloud Control Panel Access
- **Direct link:** Logs Data Platform
- **Navigation path:** Identity, Security & Operations > Logs Data Platform > Select the platform concerned
***
## Preparation
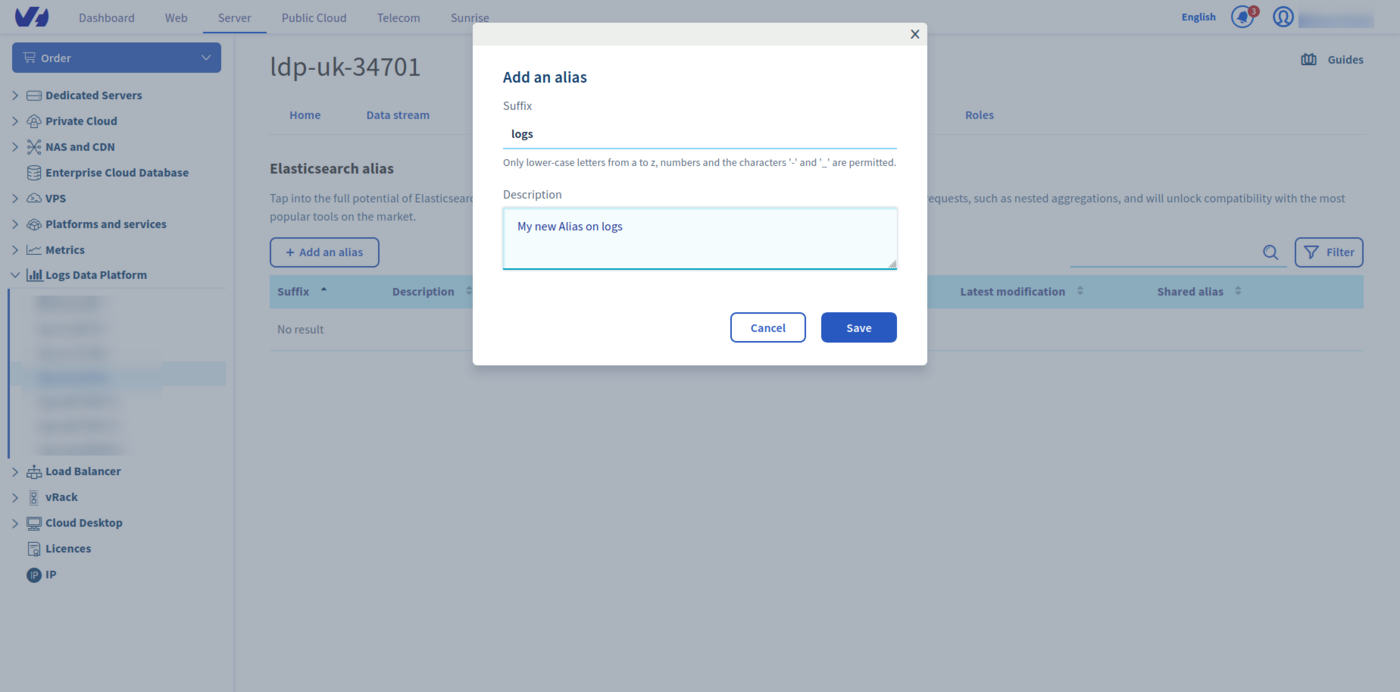
In order to deploy ElastAlert, it is important that you have data for which you can see alerts. If you only have Graylog stream, you can use aliases to enable the OpenSearch API on your stream data. Here is how:
1. In the Alias tab, click the Add an alias button.
2. Choose a name and define a description for your alias.
3. Save the entry by clicking the Save button.
4. Once the alias has been created. Use the **...** menu on the right side and select the Attach content to the alias option.
5. Define there the data streams you want to associate to your alias.
6. That's it.
If you only have [indices](/es/guides/manage-and-operate/observability/logs-data-platform/index-as-a-service.md), you can use them directly in the ElastAlert configuration.
## Instructions
ElastAlert configuration consists of three steps:
- Installing ElastAlert and its metadata indices.
- Configuring the main configuration file.
- Configuring the alert rules.
### Installation
Installing ElastAlert can be done in different ways as described in their [documentation](https://elastalert2.readthedocs.io/en/latest/elastalert.html#running-elastalert). You can either use the docker image or install the python 3 packages. You must check that your Python version is the one compatible with ElastAlert. Check the documentation to verify which version of Python is compatible. Be sure also to meet all the [requirements](https://elastalert2.readthedocs.io/en/latest/running_elastalert.html#requirements) before attempting the installation.
You can either install the latest released version of ElastAlert 2 using pip:
```bash
$ pip install elastalert2
```
or you can first clone the ElastAlert2 repository for the most recent changes:
```bash
$ git clone https://github.com/jertel/elastalert2.git
```
And then install the module:
```bash
$ pip install "setuptools>=11.3"
$ python setup.py install
```
If there is any error about any missing packages, install them manually. For example:
```bash
$ pip install setuptools_rust
```
The next step is to configure ElastAlert meta-indices using the provided tool **elastalert-create-index**.
ElastAlert needs **5** indices to operate:
- The **generic** index containing all active alerts.
- The **status** index containing the queries run to trigger the alerts.
- The **error** index with all the errors encountered.
- The **silence** index indicating if a recurring alert should be triggered or silenced.
- The **past** index with all the alerts triggered and closed.
The following command will create the indices on Logs Data Platform directly from OpenSearch API.
```bash
$ elastalert-create-index --host .logs.ovh.com --port 9200 --username `` --password --ssl --index -i-``
```
You should pay attention to the following points:
- The `` must be the one assigned to you (find on the **Home** page of the LDP Manager).
- `` is the username used to connect to the API or to the Logs Data Platform interfaces (Graylog or OpenSearch Dashboards).
- `` is the associated password. You can use [tokens](/es/guides/manage-and-operate/observability/logs-data-platform/tokens.md) in place of the username/password couple for your credentials.
- The `--index` is the most important here since you **must** follow the index naming convention of Logs Data Platform. Use the presented form `-i-` as a base name for your meta-indices. `` can be personalized to any alphanumeric characters.
This command will prompt you with different questions:
```bash
Verify TLS certificates? t/f: t
Enter optional OpenSearch URL prefix (prepends a string to the URL of every request):
Name of existing index to copy? (Default None)
Reading Elastic 8 index mappings:
Reading index mapping 'es_mappings/8/silence.json'
Reading index mapping 'es_mappings/8/elastalert_status.json'
Reading index mapping 'es_mappings/8/elastalert.json'
Reading index mapping 'es_mappings/8/past_elastalert.json'
Reading index mapping 'es_mappings/8/elastalert_error.json'
New index logs-**-*****-i-***** created
Done!
```
This will then create 5 indices and place the mapping on them. All you need after is to create the ElastAlert configuration file and some rules.
### ElastAlert configuration file.
Create a configuration directory (for example /opt/elastalert/) and a rule directory before continuing (like /opt/elastalert/rules). This rule directory will be used in the configuration below.
Without further delay here is a sample **config.yml** file you can use for your configuration in your configuration directory:
```yaml
rules_folder: /opt/elastalert/rules
run_every:
minutes: 5
buffer_time:
hours: 6
es_host: .logs.ovh.com
es_port: 9200
use_ssl: True
verify_certs: True
es_username: ``
es_password:
writeback_index: ``-i-``
alert_time_limit:
days: 2
```
You can find all the available options [here](https://elastalert2.readthedocs.io/en/latest/running_elastalert.html#downloading-and-configuring).
- **rules\_folder** is where ElastAlert will load rule configuration files from. It will attempt to load every .yaml file in the folder. Without any valid rules in this folder, ElastAlert will not start.
- **run\_every** is how often ElastAlert will query OpenSearch.
- **buffer\_time** is the size of the query window, stretching backwards from the time each query is run.
- **es\_host** is the address of an OpenSearch cluster where ElastAlert will store data about its state, queries run, alerts, and errors. Each rule may also use a different OpenSearch host to query against.
- **es\_port** is the port corresponding to es\_host.
- **use\_ssl**: whether or not to connect to es\_host using TLS. TLS is mandatory in our platform.
- **verify\_certs** whether or not to verify TLS certificates. Our platform uses certificates validated by most operating systems and browsers.
- **es\_username** is the username used to connect to OpenSearch APIs.
- **es\_password** is the password used to connect to OpenSearch APIs. Remember that you can use tokens in place of these credentials.
- **writeback\_index** is the name of the index in which ElastAlert will store data. Use the same name you used to configure indices with `elastalert-create-index`.
- **alert\_time\_limit** is the retry window for failed alerts.
### Rules configuration
In this example, we will create a [frequency.yml](https://elastalert2.readthedocs.io/en/latest/ruletypes.html#frequency) rule which will send a email if the field **user** with the value **Oles** appears more than **3** times in less than **4 hours** and use the debug logger **debug**.
```yaml
name: Example frequency rule
# (Required)
# Type of alert.
# the frequency rule type alerts when num_events events occur with timeframe time
type: frequency
# (Required)
# Index to search, wildcard supported
index:
# (Required, frequency specific)
# Alert when this many documents matching the query occur within a timeframe
num_events: 3
# (Required, frequency specific)
# num_events must occur within this amount of time to trigger an alert
timeframe:
hours: 4
timestamp_field: timestamp
timestamp_type: custom
timestamp_format: '%Y-%m-%d %H:%M:%S.%f'
timestamp_format_expr: 'ts[:23]'
timestamp_to_datetime_format_expr: 'ts[:23]'
# (Required)
# A list of OpenSearch filters used for find events
# These filters are joined with AND and nested in a filtered query
# For more info: https://opensearch.org/docs/latest/opensearch/query-dsl/index/
filter:
- term:
user: "Oles"
# (Required)
# The alert is used when a match is found
alert:
- "debug"
```
We won't detail all the parameters since most of them are self-explanatory. However, please pay attention to the **index** parameter. This index or alias is the one containing the logs or documents you want to be alerted from.
It's also important to customize the timestamp parameters according to the timestamp of your logs or documents. Here we customize a **custom** timestamp on the **timestamp\_field** `timestamp` with the format used in the logs pipeline `%Y-%m-%d %H:%M:%S.%f`. Because this format can have more than 3 extra numbers, we need to truncate them using the **timestamp\_format\_expr** option. Note that Elastalert does not support nanoseconds, this is why the option **timestamp\_to\_datetime\_format\_expr** cuts the timestamp string to 23 characters, so it can be parsed.
## Launch ElastAlert
To launch ElastAlert, use the following command:
```bash
$ elastalert --config config.yml --debug
```
config.yml is the main configuration file described earlier. The **--debug** option is here to ensure everything is working correctly. You can deactivate it in production when ElastAlert is fully configured.
To test your alert you can use the following curl command sending logs to our [OpenSearch endpoint](/es/guides/manage-and-operate/observability/logs-data-platform/ldp-index.md):
```bash
$ curl -H 'Content-Type: application/json' -u '``:' -XPOST https://.logs.ovh.com:9200/ldp-logs/_doc -d '{ "X-OVH-TOKEN" : "" , "test_field" : "OVHcloud" , "user": "Oles", "short_message" : "Hello OpenSearch input", "host" : "OVHcloud_elastalert" }'
```
If you send this event more than 3 times, the elastalert process will print the triggered alert.
```bash
user01@test:~/rules$ elastalert --config config.yml --debug
INFO:elastalert:Note: In debug mode, alerts will be logged to console but NOT actually sent.
To send them but remain verbose, use --verbose instead.
INFO:elastalert:Note: In debug mode, alerts will be logged to console but NOT actually sent.
To send them but remain verbose, use --verbose instead.
INFO:elastalert:1 rules loaded
INFO:elastalert:Starting up
INFO:elastalert:Disabled rules are: []
INFO:elastalert:Sleeping for 299.999899 seconds
INFO:elastalert:Queried rule Example frequency rule from 2024-08-06 04:03 EDT to 2024-08-06 10:03 EDT: 16 / 16 hits
INFO:elastalert:Skipping writing to ES: {'exponent': 0, 'rule_name': 'Example frequency rule', '@timestamp': '2024-08-06T14:03:25.155726Z', 'until': '2024-08-06T14:04:25.155713Z'}
INFO:elastalert:Alert for Example frequency rule at 2024-08-06T13:46:26.335Z:
INFO:elastalert:Example frequency rule
```
ElastAlert has a lot of integrations for alerting including Email, JIRA, OpsGenie, SNS, HipChat, Slack, MS Teams, PagerDuty, Zabbix, custom commands and [many more](https://elastalert2.readthedocs.io/en/latest/ruletypes.html#alerts).
## Go further
- Getting Started: [Quick Start](/es/guides/manage-and-operate/observability/logs-data-platform/getting-started-quick-start.md)
- Documentation: [Guides](/es/guides/manage-and-operate/observability/logs-data-platform/overview.md)
- Community hub: [community of users](https://community.ovhcloud.com/)
- Create an account: [Try it!](https://www.ovhcloud.com/en-gb/identity-security-operations/logs-data-platform/)